Improving Website Search Keyword Performance — Rittman Analytics
A few weeks ago when checking our company website stats in Looker, I noticed that total sessions had dropped significantly since we updated it back in August.
Visitor numbers were down too and my first thought was that something about the design, usability or changes to content we may have introduced were putting-off visitors.
As the vast majority of traffic to our site is anonymous and therefore hard to track across sessions more than a couple of days apart, analyzing visitors by new and returning wouldn’t tell us much about whether visitors were in-fact returning after their first visit.
What we could do though is calculate our average page views/session rate across time along with the % of sessions that weren’t classed as “bounce” sessions, both of which indicated that visitors who do make it to the new site are in-fact more engaged, and within those sessions go on to look at more pages on the site than visitors to the previous version.
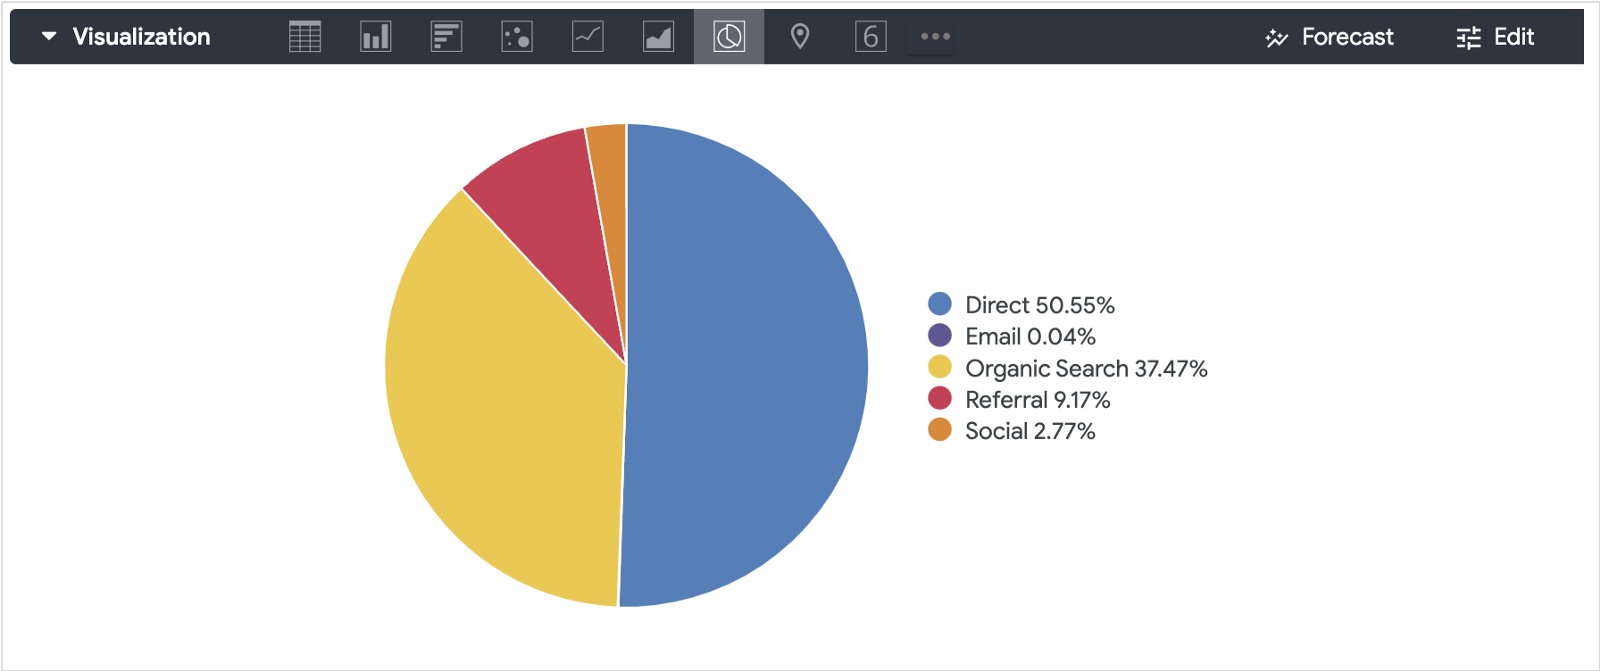
So it’s unlikely to be copy or UX issues driving the drop in traffic, but what about the sources of that traffic? We categorise the various ways by which a visitor arrives at our site into a few standard ways:
-
Direct for when someone types our site URL into their browser address bar, or more likely, when there’s an absence of any other useful information from which we can derive the traffic source
-
Social for when the traffic comes from Twitter, LinkedIn, Medium or another social network
-
Organic Search for when traffic comes from people clicking on our site in search engine results, typically Google Search
-
Referral for when a third-party site, for example segment.com or getdbt.com/partners contains a link to our content
-
Email, for when the visitor clicked-on a link in one of our newsletters
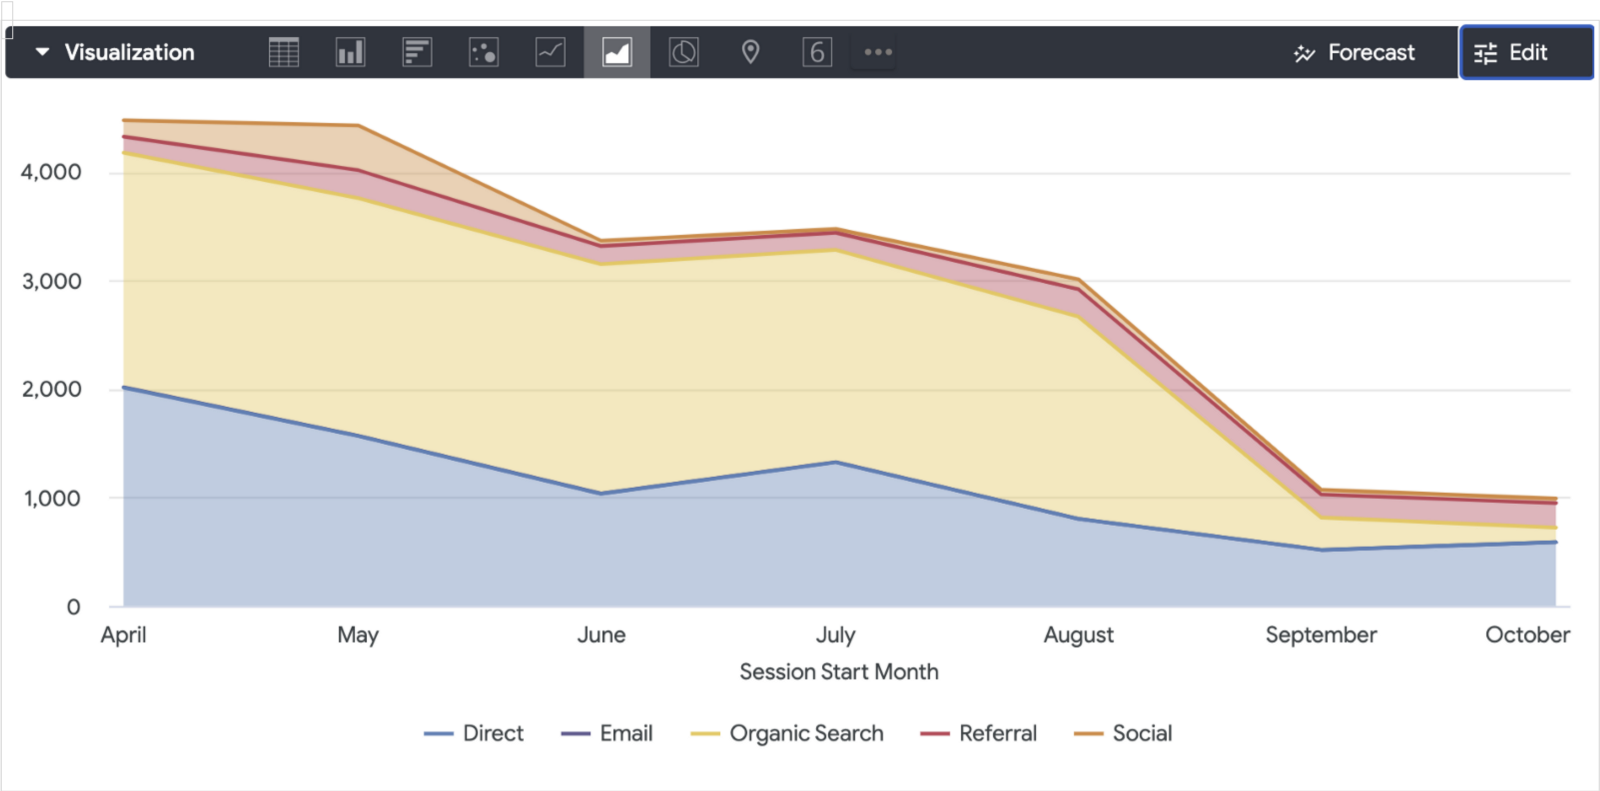
Breaking-down those sessions by these traffic acquisition channels showed clearly that, whilst the volume of traffic from referral sources along with email, social and direct had remained at similar levels to before the site update, organic search traffic had cratered to around one-third of its previous level.
This was particularly worrying as just under 40% of the “visitor value” of traffic to our site came search traffic, a marketing measure we calculate by assigning a score to each category of page on our site that values views of our marketing and services pages higher than ones of our blog and podcast content. A higher visitor value for a session or channel helps us work-out which channels bring us potential new clients vs. ones that are only interested in our technical content right now.
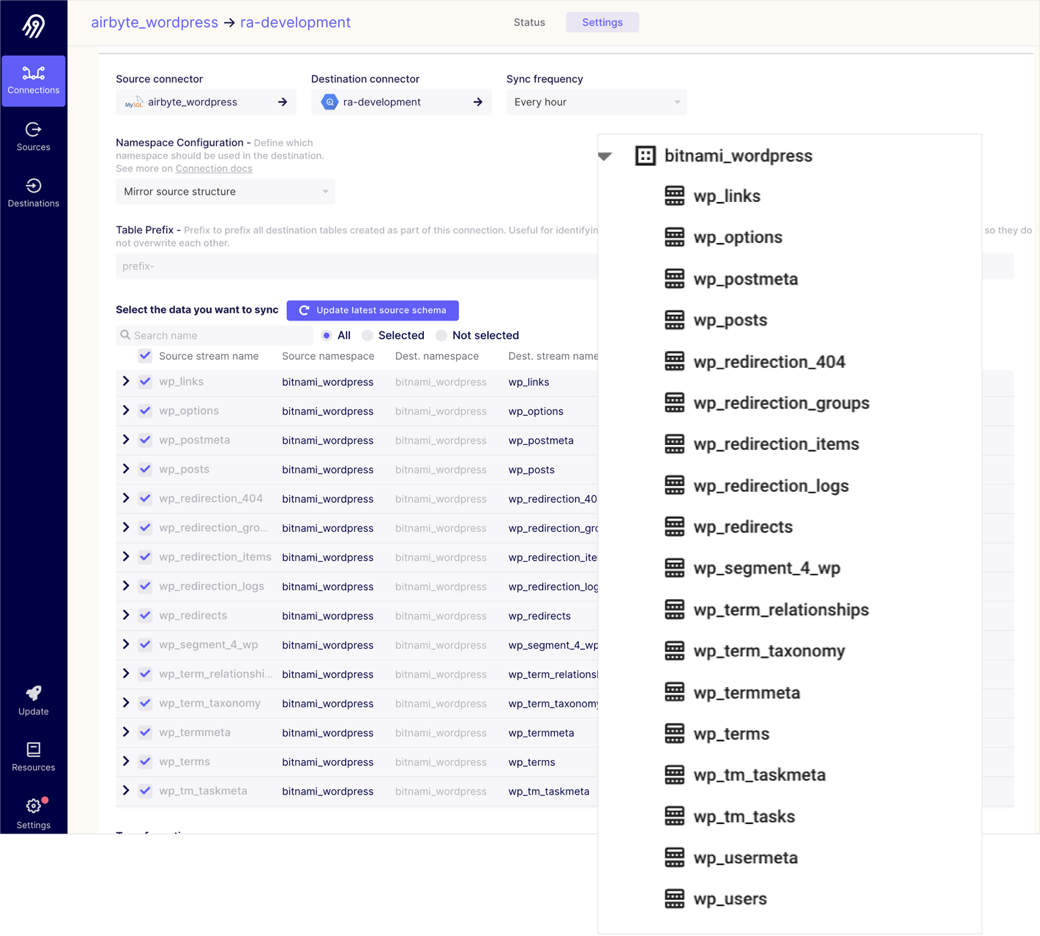
We’d taken the opportunity to move the site from Squarespace to WordPress when updating its content, and now host it on a GCE VM on our own GCP cloud infrastructure. A big part of the motivation for this move was the opportunity it provided for making use of the CMS data that WordPress stores in an embedded mySQL database, which we’d have access to as we were hosting it rather than running it on wordpress.com or another managed hosting service.
The WordPress database schema contains all of the page, post and other site content along with the categorisation and taxonomy for that content, details of authors, counts of comments and so on.
Adding that data to our Google BigQuery warehouse and Looker dashboards would give us a canonical reference list of pages on our website that we could join our visitor event data from services such as Rudderstack, Segment, Snowplow and GA4, rather than trying to reconstruct those page details from the context data that those services recorded with page view and other visitor events.
Moreover, if we connected this CMS data from WordPress and the visitor event tracking data we collected via Rudderstack to another data source we’d recently brought into our warehouse, Google Search Console, we could start to try and work out what had changed and what might have gone wrong.
Whereas Google Analytics records visits and visitor details from traffic across all sources to your website but can’t tell you why each visit occurred, Google Search Console allows you to deep-dive into the search activity that comes from Google Searches.
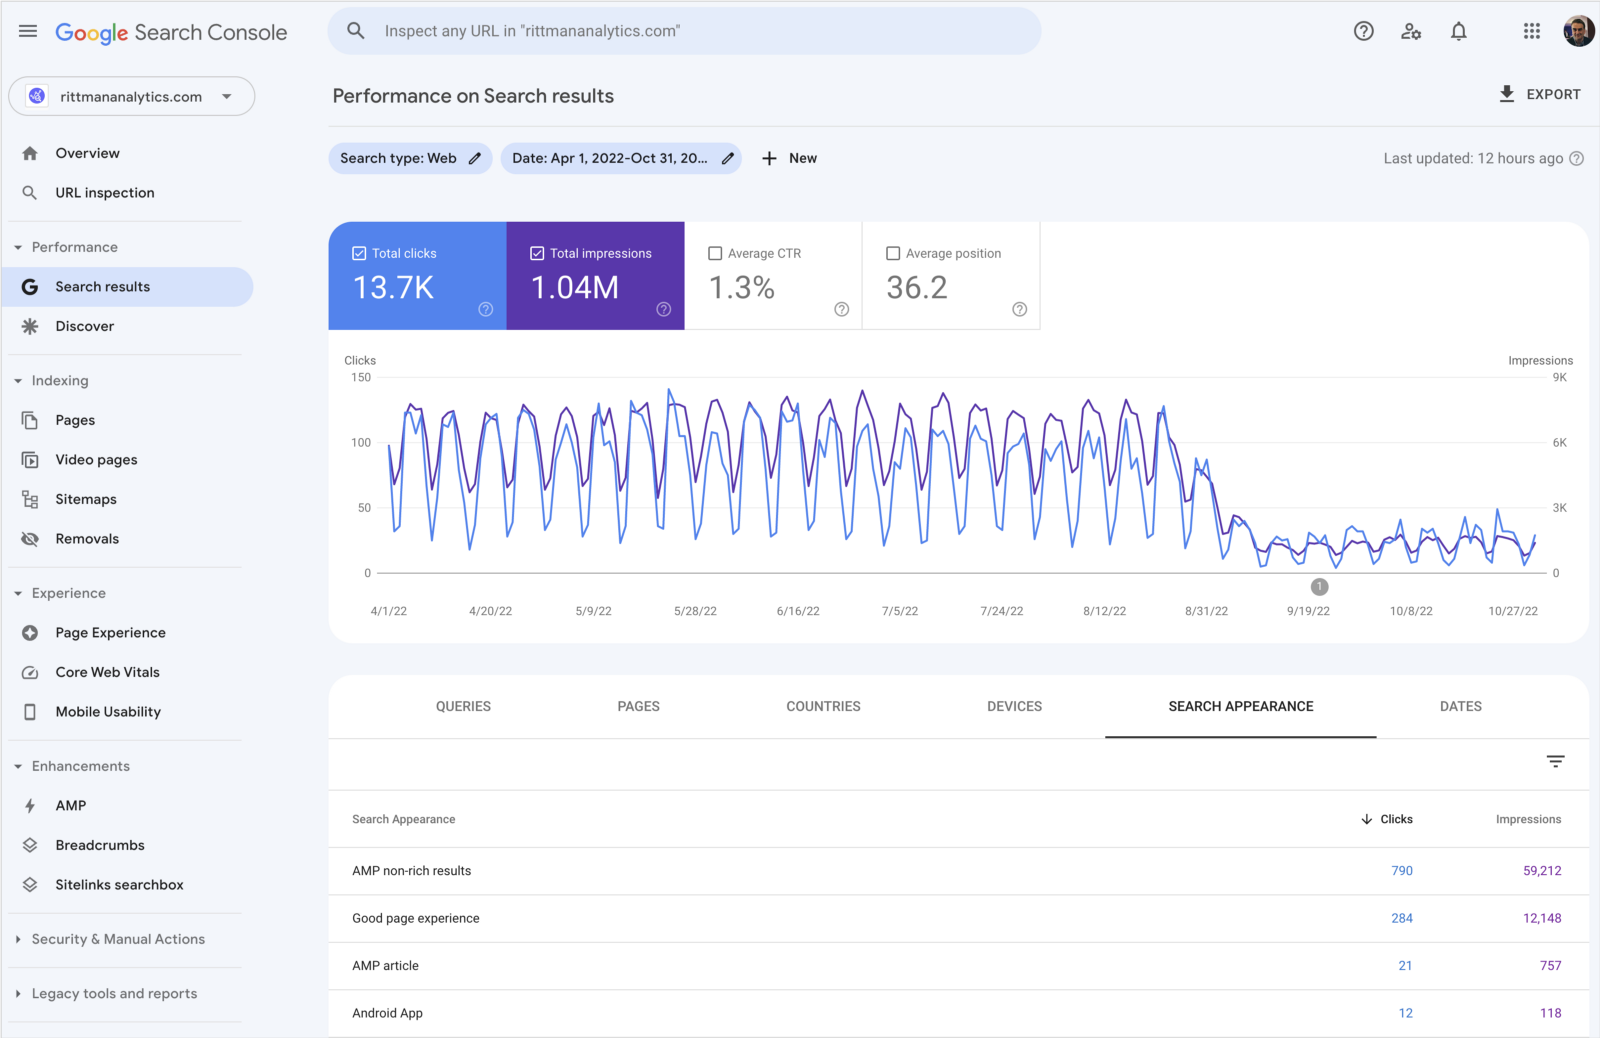
The main use marketers and in-particular SEO (search engine optimization) experts have for Search Console data is to understand and then improve the relevance that Google’s algorithm places on your content, firstly by optimizing that content or your overall site to rank higher in “organic” search results.
The other approach is where you buy those search impressions and hopefully, click-throughs, by targeting a selection of keywords that historically have brought high-value converting users to your site and bidding for those keywords, a traffic type we categorise as ppc (pay-per-click).
The schema provided by Fivetran for data replicated into your warehouse from the API provided for Google Search Console consists of a number of report-style tables that aggregate your search data by various combinations of site, keyword, page and time dimensions.
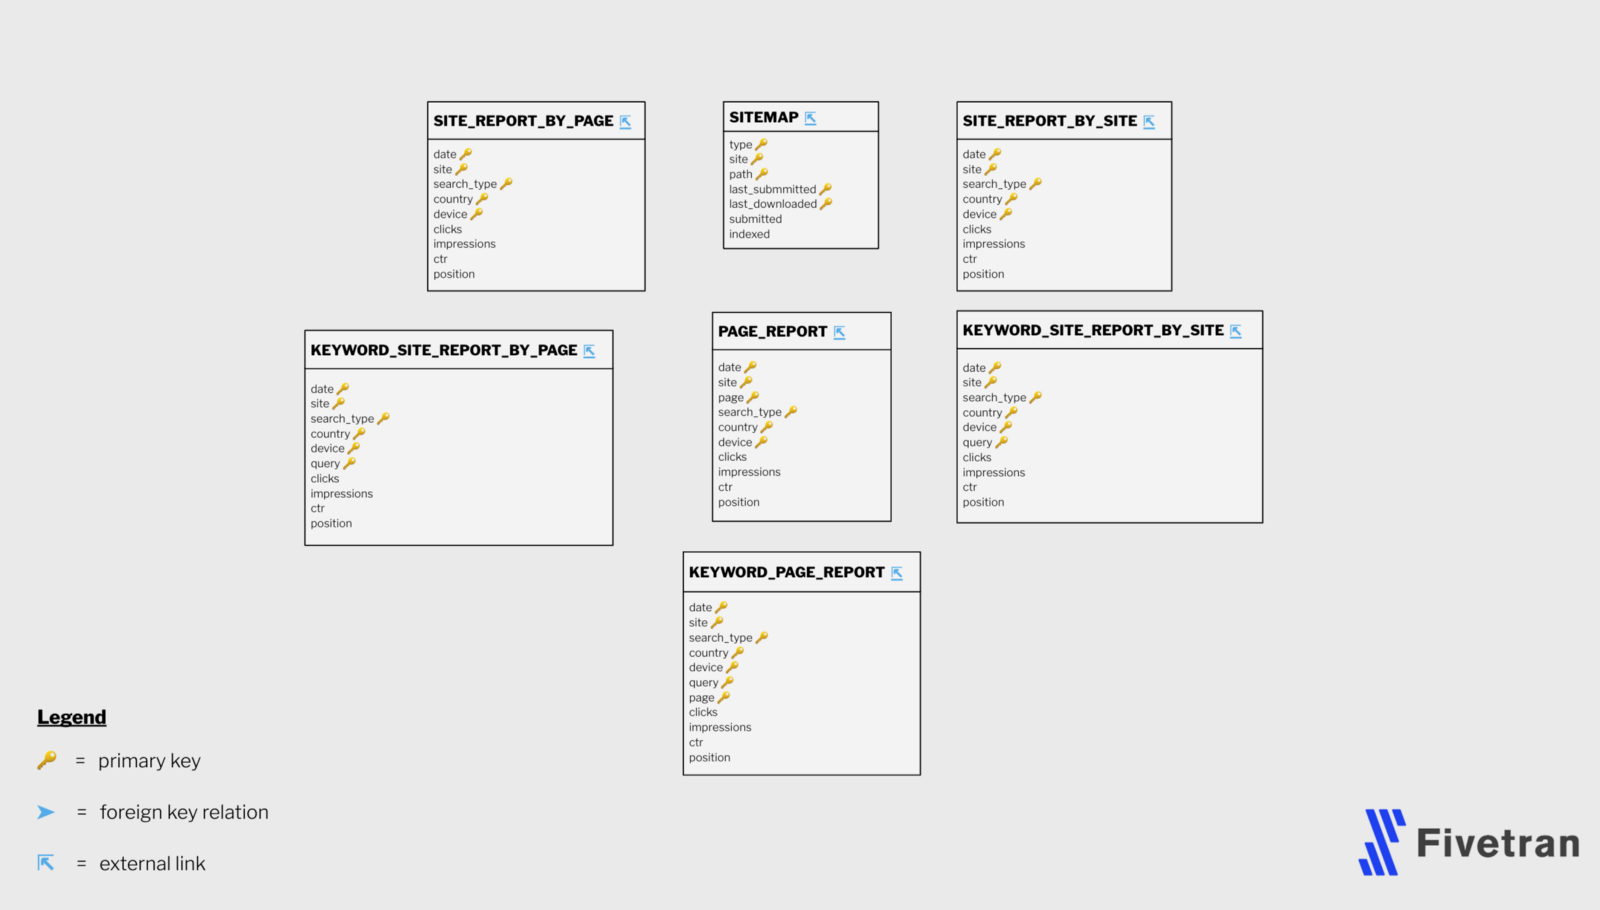
In this instance I needed the KEYWORD_PAGE_REPORT table that provided the search traffic data of the pages of our site based on the query string user searched for on Google, giving me the ability to see what search keywords were generating traffic for each of our site pages and how our search stats were trending over time.
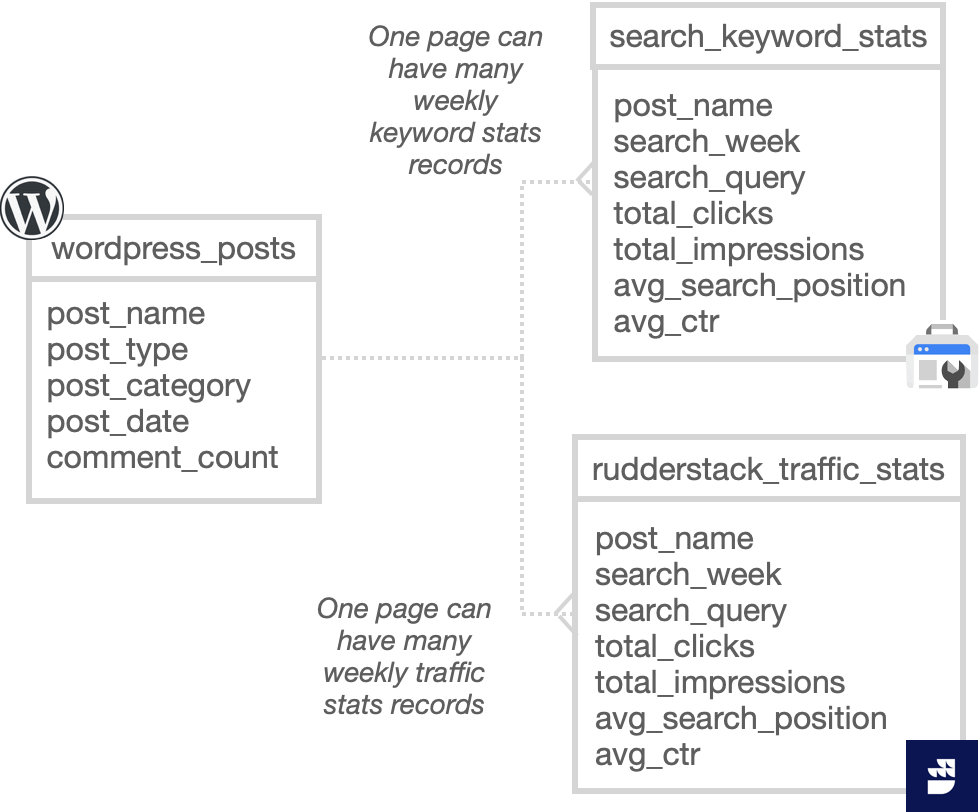
I started by shaping and preparing these datasets initially in Looker, first by creating a LookML view that added page type and category metadata to our WordPress blog, podcast and marketing pages (code here).
Next I took our existing Rudderstack page event data, aggregated it to the week level and transformed the path context variable into a format that could be used to join these page events to the page_name format that WordPress uses (code here), and then aggregated the Keyword Page Report table data to the same week-level (code here) and then finally, added a new explore to our Looker model to join them all together on the page_name WordPress page URL slug.
I now had a Looker explore that gave me, per week, the volume of traffic we’d received at the site along with the clicks, impressions, average search results position and average click-through-rate for traffic coming to those pages from Google Search users.
Over the following days I put together the dashboard below that helped identify the cause of this drop in organic search traffic, fix the issues that caused that drop and now use to make our future marketing activity more relevant and effective.
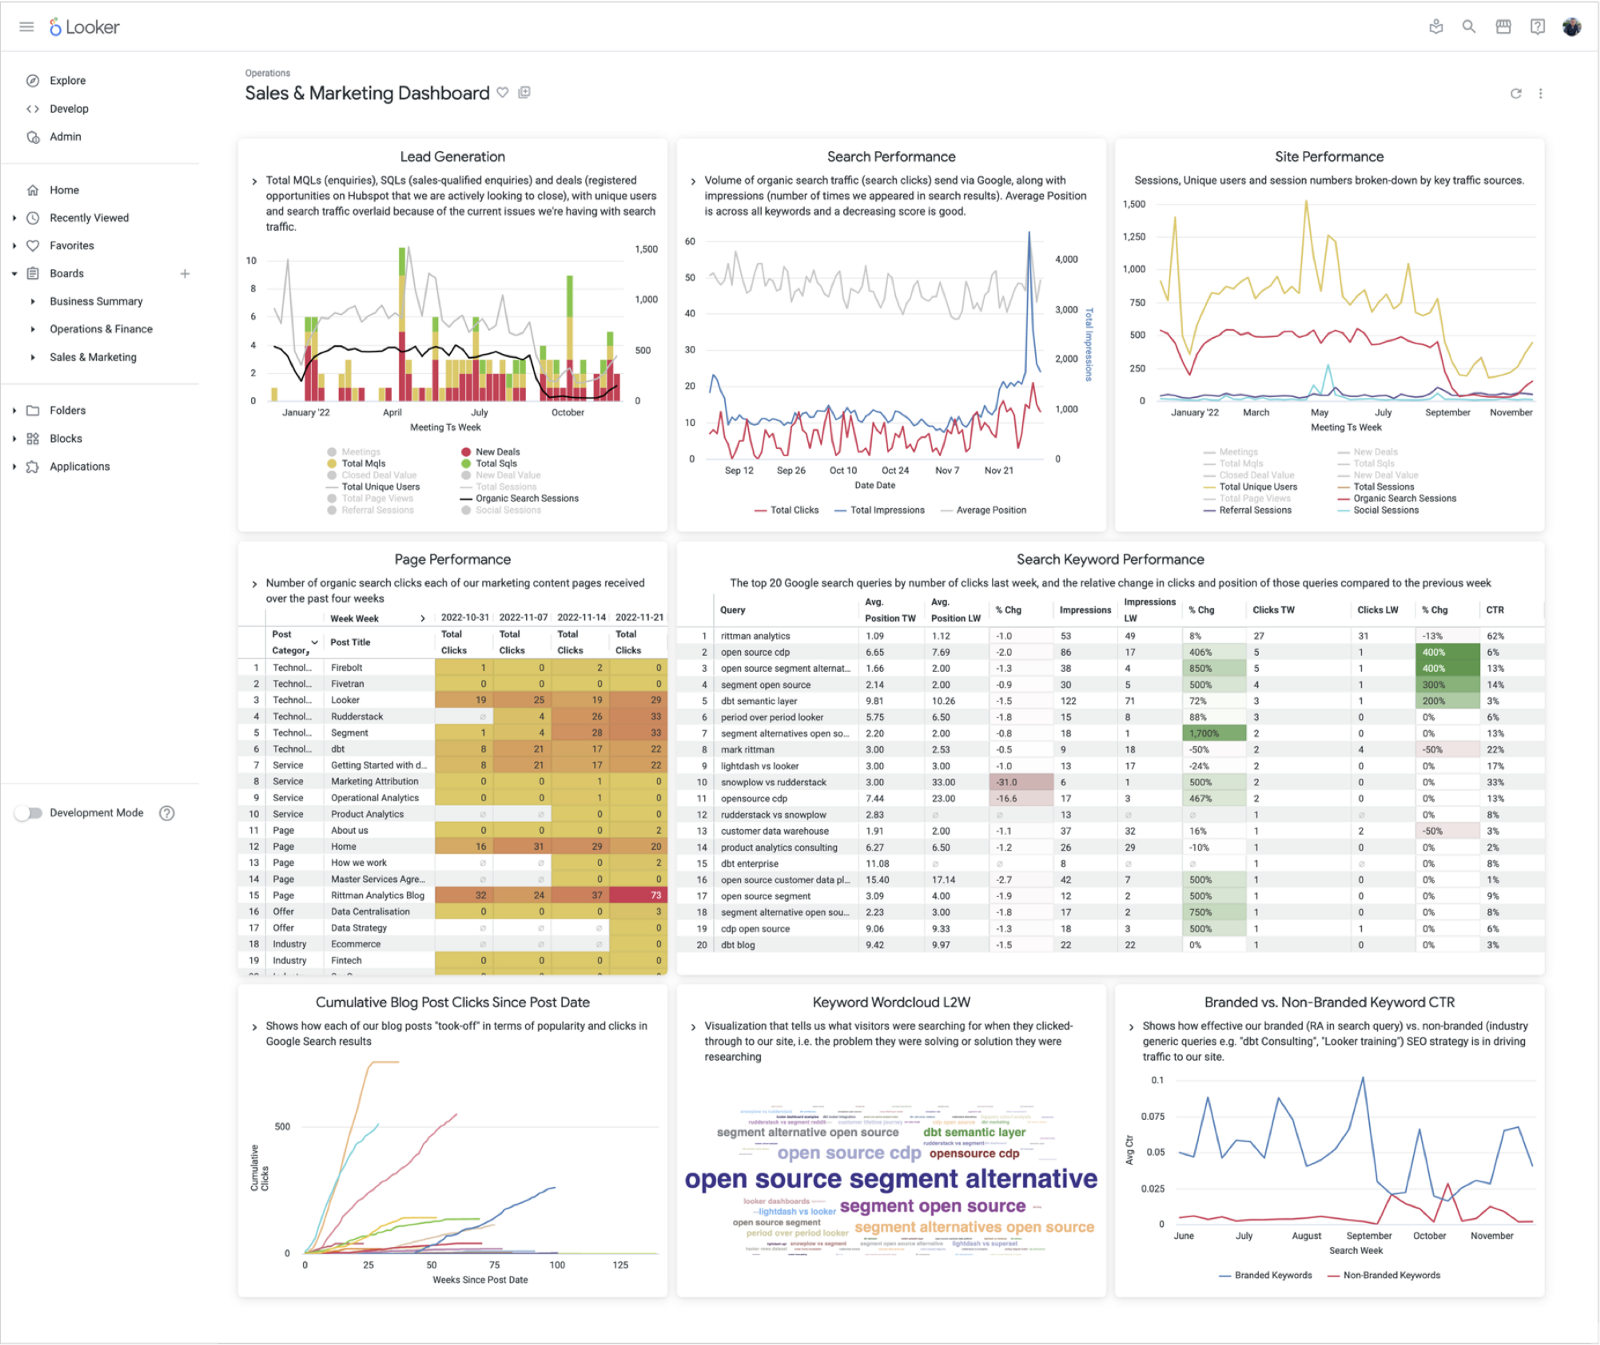
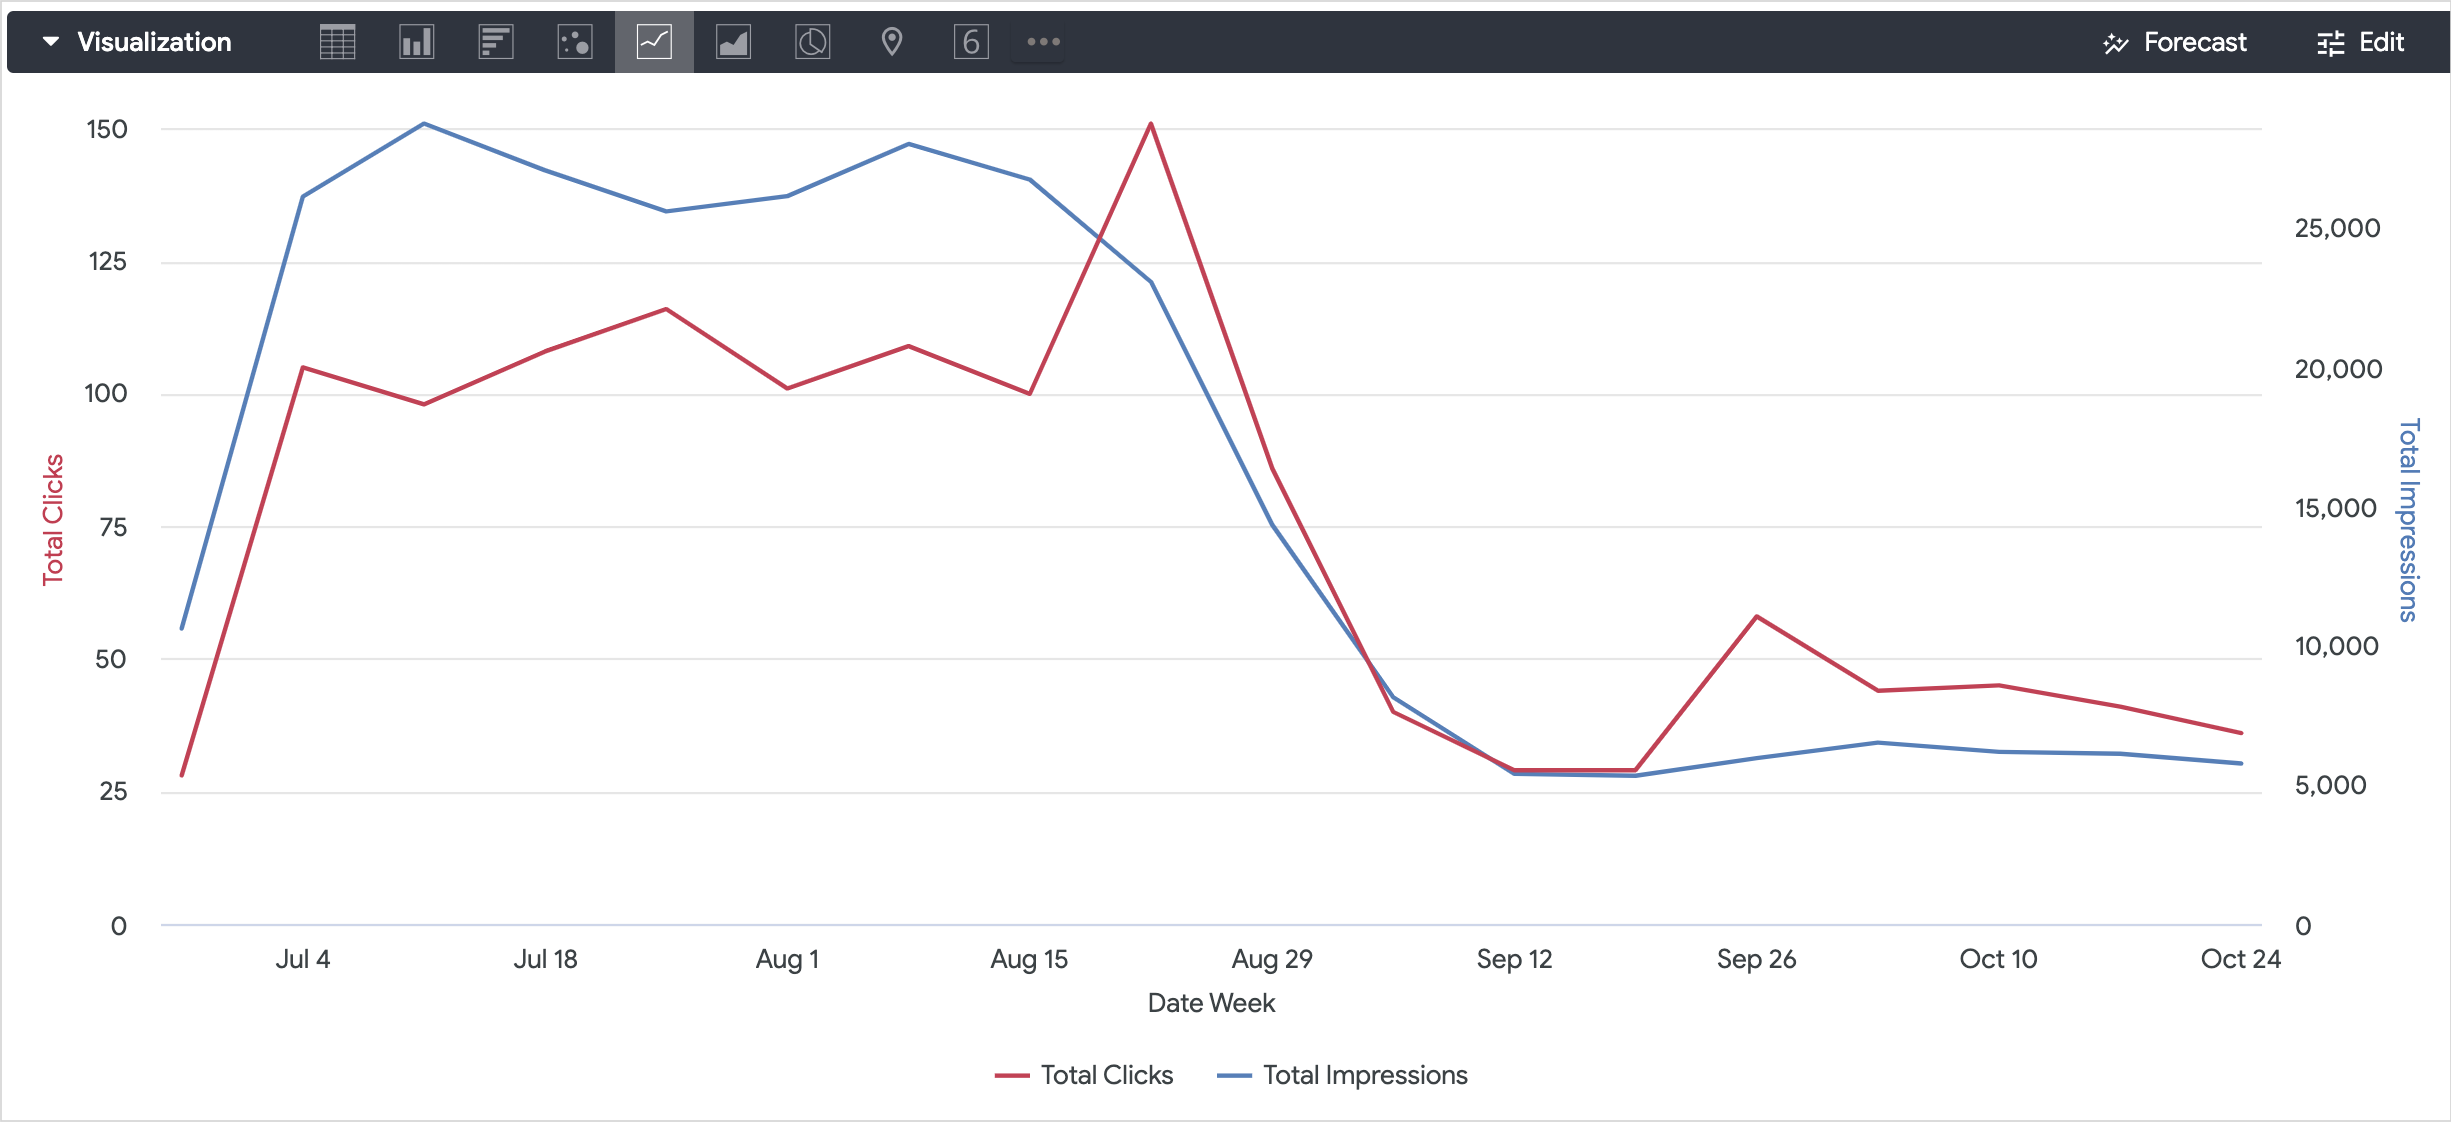
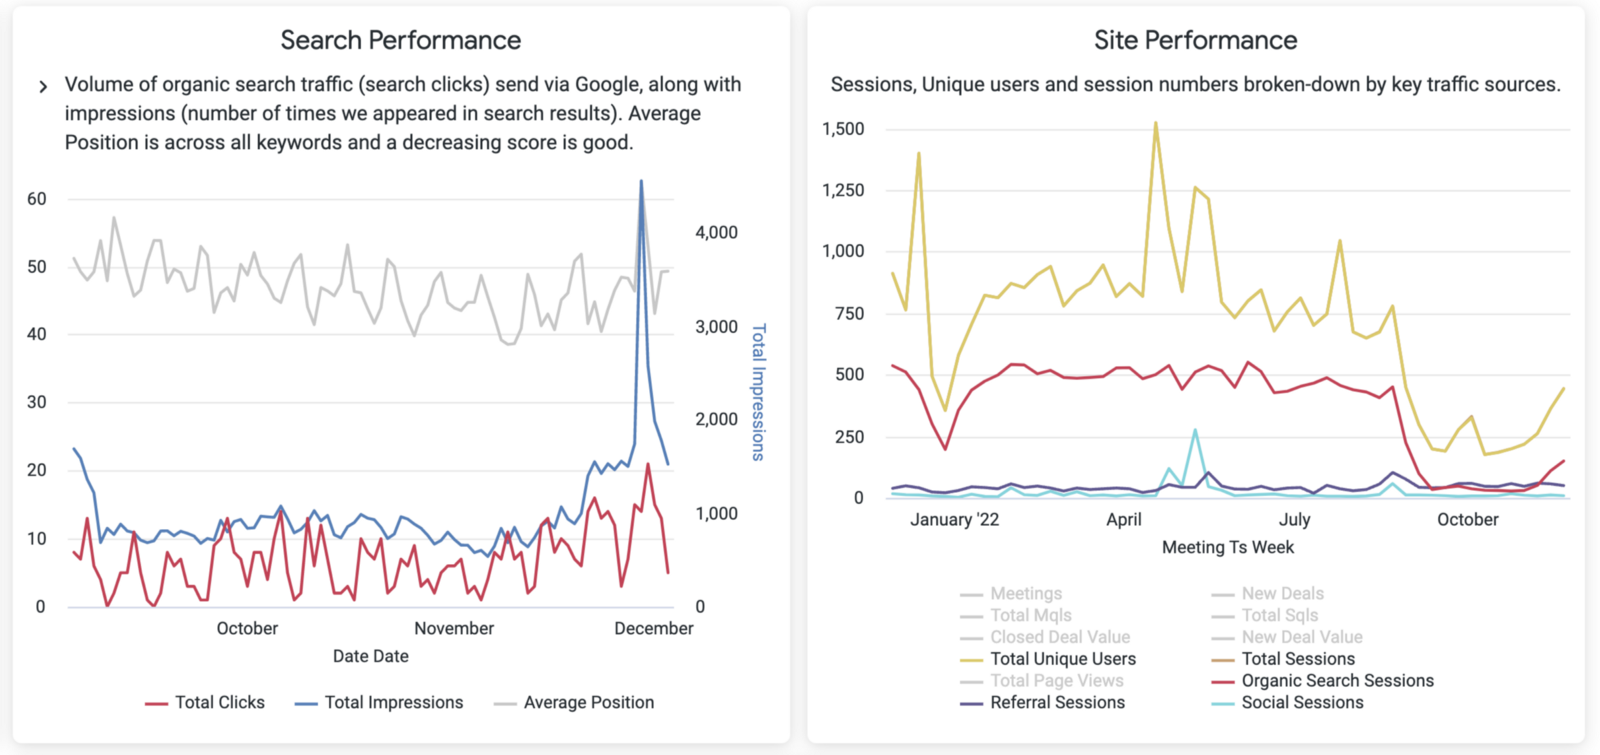
The charts and data in the dashboard above show the position we’re in now, but back at the start of November our Looker explore was showing us that both clicks (the number of search users clicking-through to our site from search results) and impressions (the number of times we appeared in search results) were down, suggesting that the drop is likely due to our site content being included in less search results for some reason, which fairly obviously would lead to less clicks through to our site.
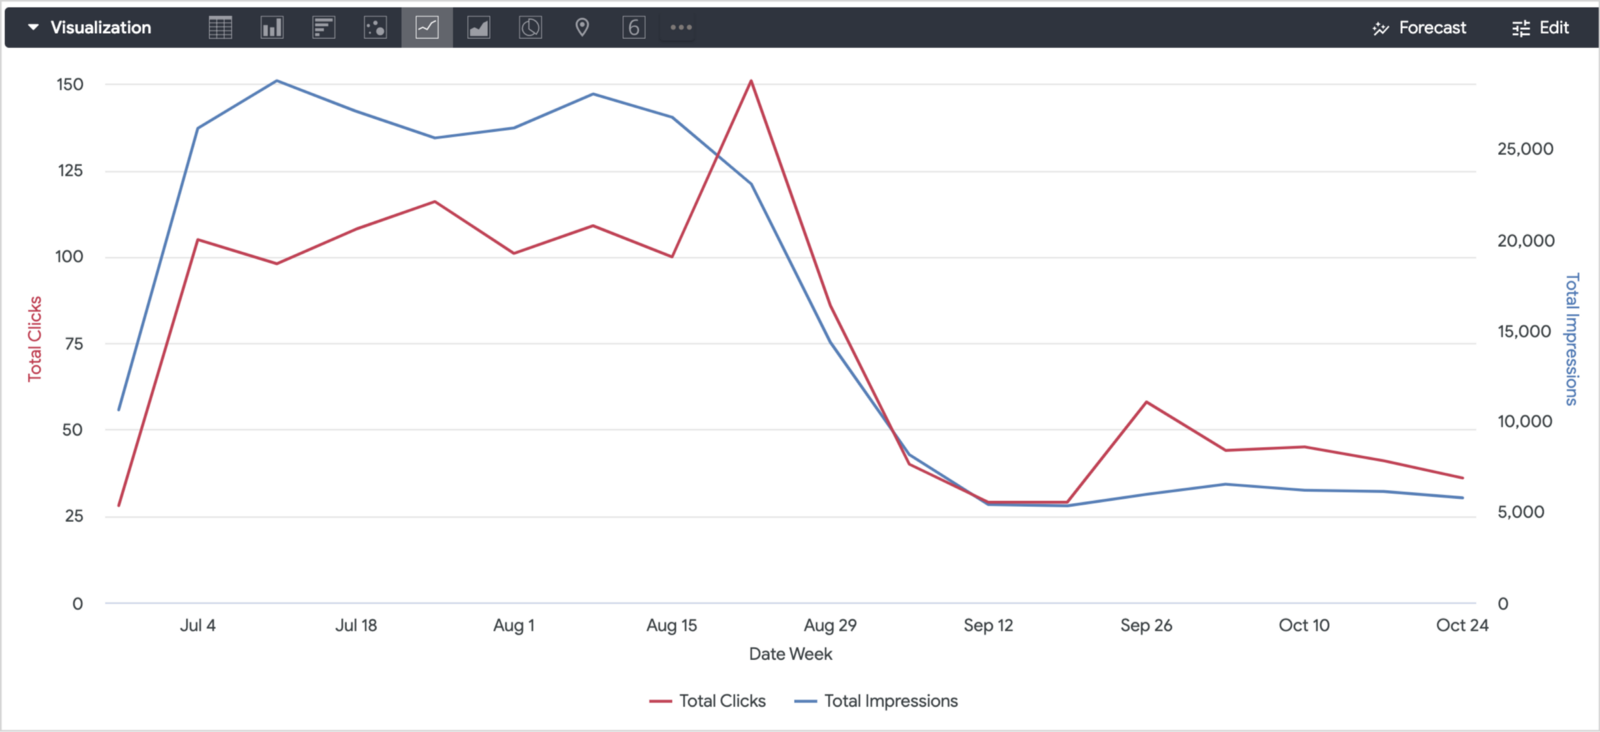
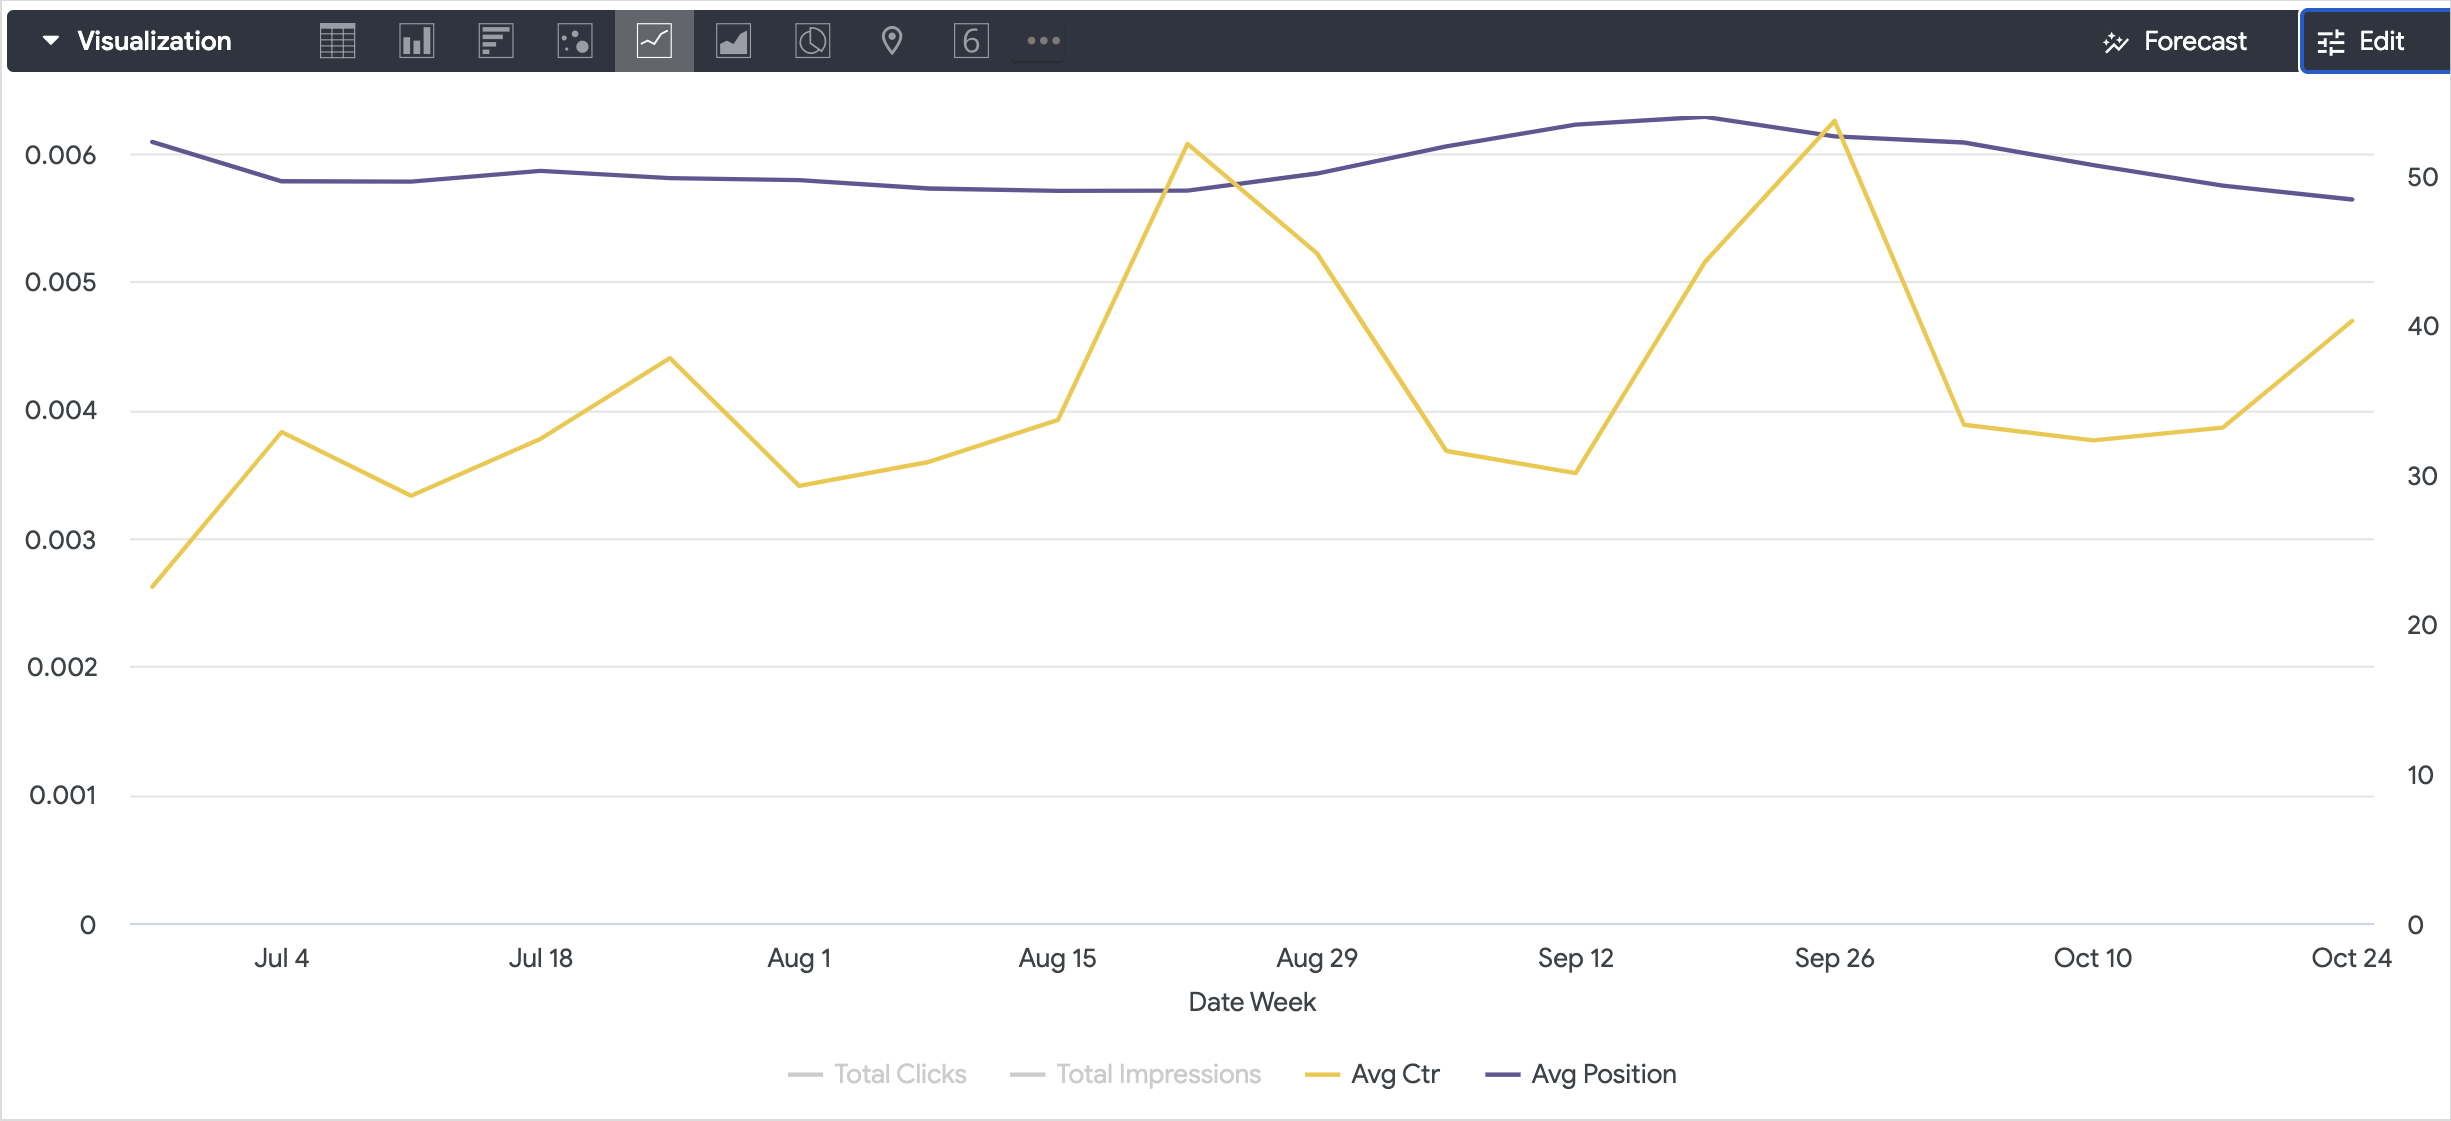
If we looked at the click-through rate over that period though, it had remained fairly constant. Plotting our average search results position isn’t really a relevant measure at the overall site and keyword level as it includes all the keywords that we don’t optimize our SEO for, where we appear in the search results but as result #50, for example.
Its when you get down to clicks, impressions and search position measures at the individual search keyword level though, that these Search Console numbers become more relevant.
I started by filtering those search stats to just the two weeks that span the old site going offline and the new one coming online, I pivot those two weeks in my explore results and calculate a bunch of variance, % variance and positional measures to create a look that will show me the change in clicks, impressions and average search position as we transitioned to the new site version.
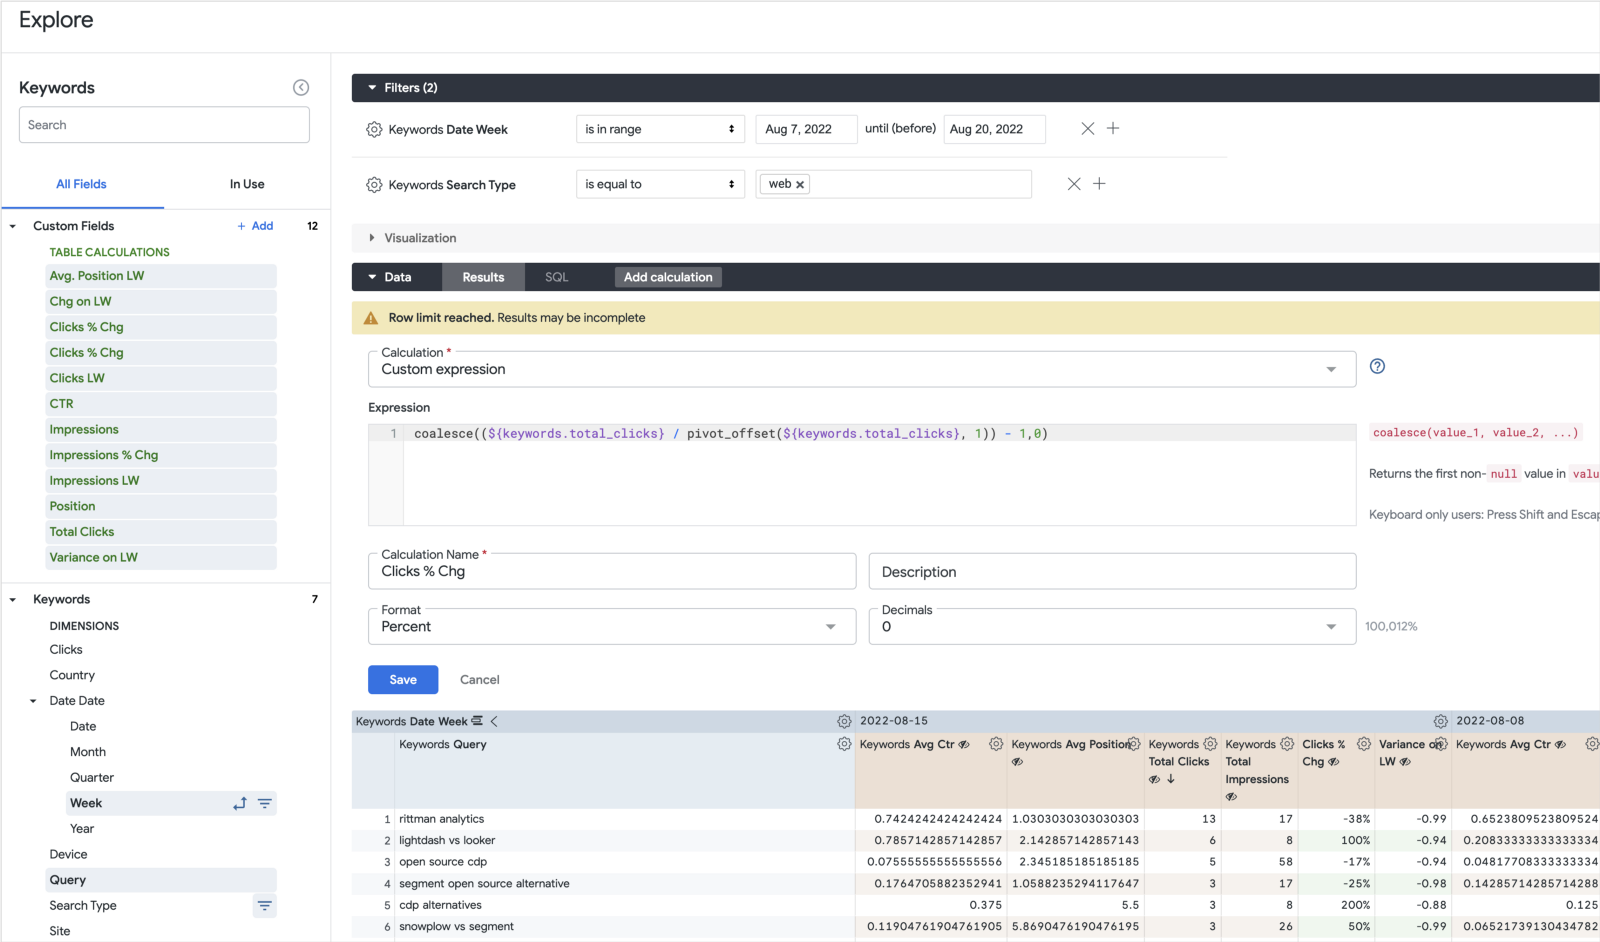
When we saw the query results in Looker, across the board we could see pretty significant falls in the number of impressions, that, in-turn led to serious drops in click-throughs as users can only click on us if we’re actually in the results of a search.
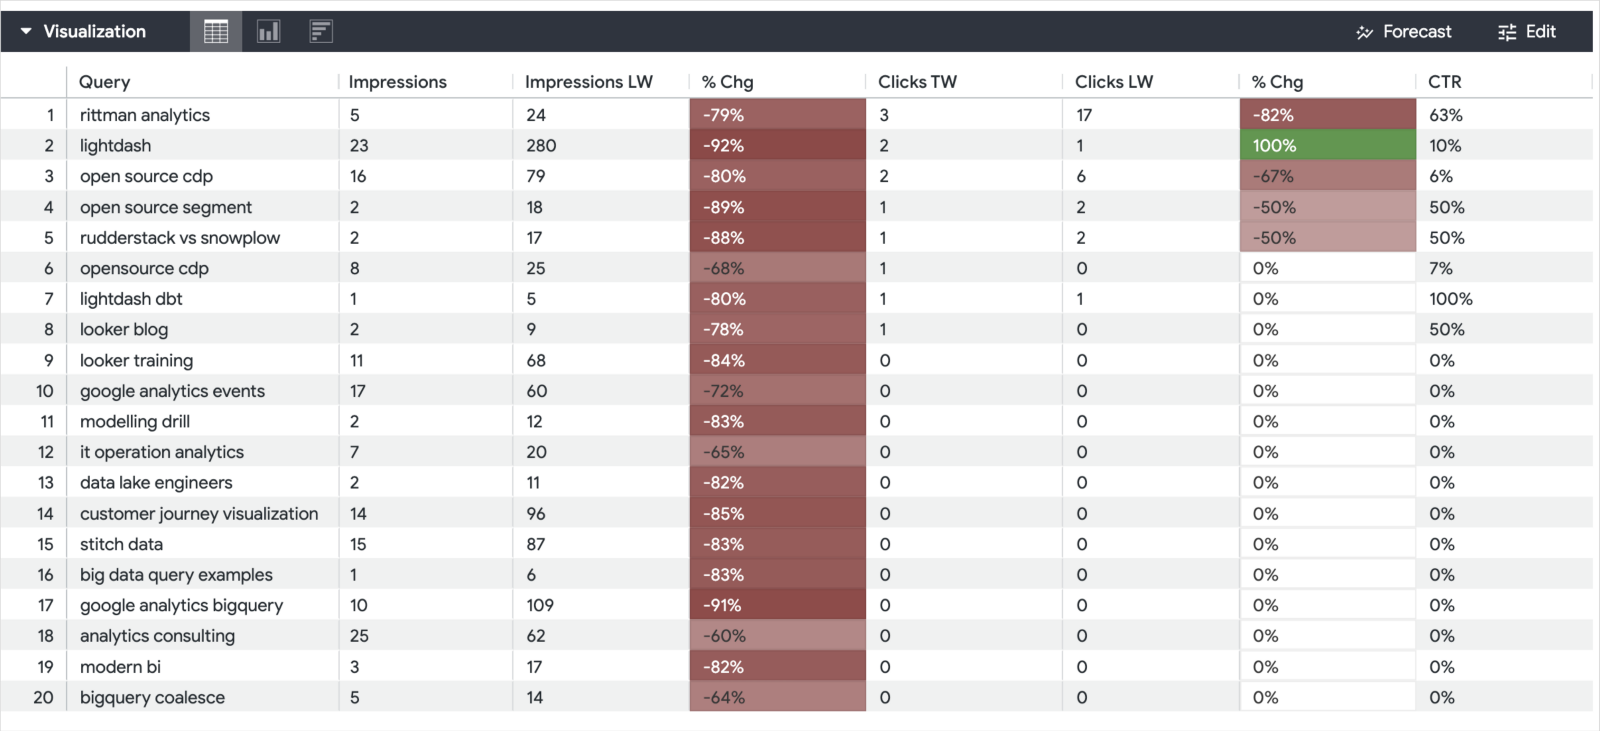
So something about the new site had clearly caused caused our content — blog articles, podcast episodes and our marketing and information pages — to disappear off of Google’s search results.
And this is where our data-based investigations stopped and we called-in the SEO expert from our marketing agency who we’d brought in to help with some activity coming in the New Year. The problem was indeed our site disappearing from search results and the cause was a combination of factors, primarily around URL formats not matching the ones used on our previous site and the site not having caching enabled and therefore being seen as too slow to provide a suitable user experience for mobile device users.
Now we understood why overall traffic had dropped (we’d lost our traffic coming from Google Search results), confirmed that this was the case (individual keyword impressions, clicks and average position stats) and also checked that users who did make it to our site stayed longer, and made more enquiry bookings than before (page view, session and conversion stats from Rudderstack), we knew the problem was an SEO one caused by our site speed and set-up Cloudflare caching and a bunch of other optimizations.
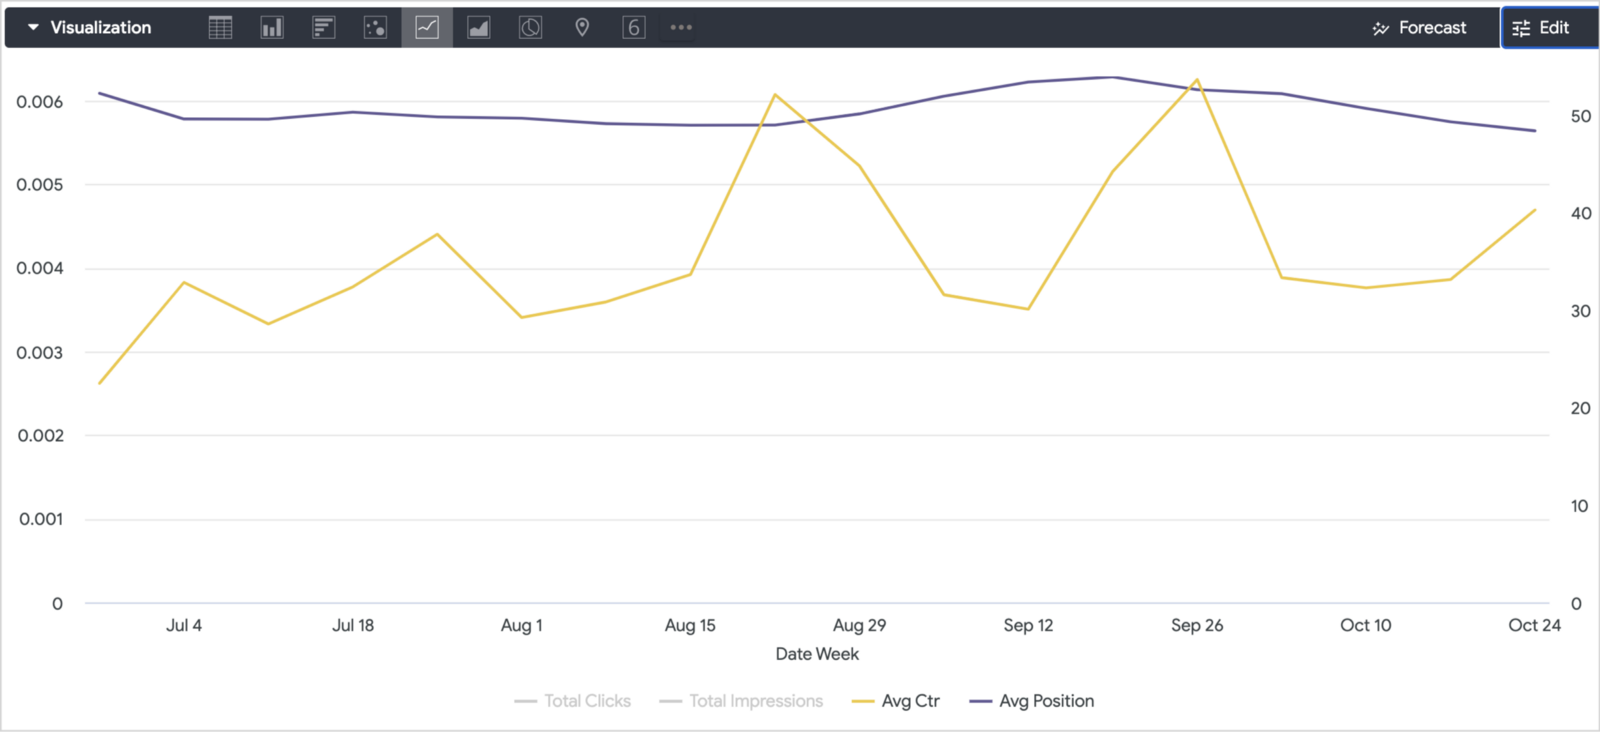
The happy-ending to the story can be seen in another Looker visualization as-of today, where we’ve joined the Google Search Console numbers to the page content metadata from WordPress to show the click traffic coming from Google over the past four weeks.
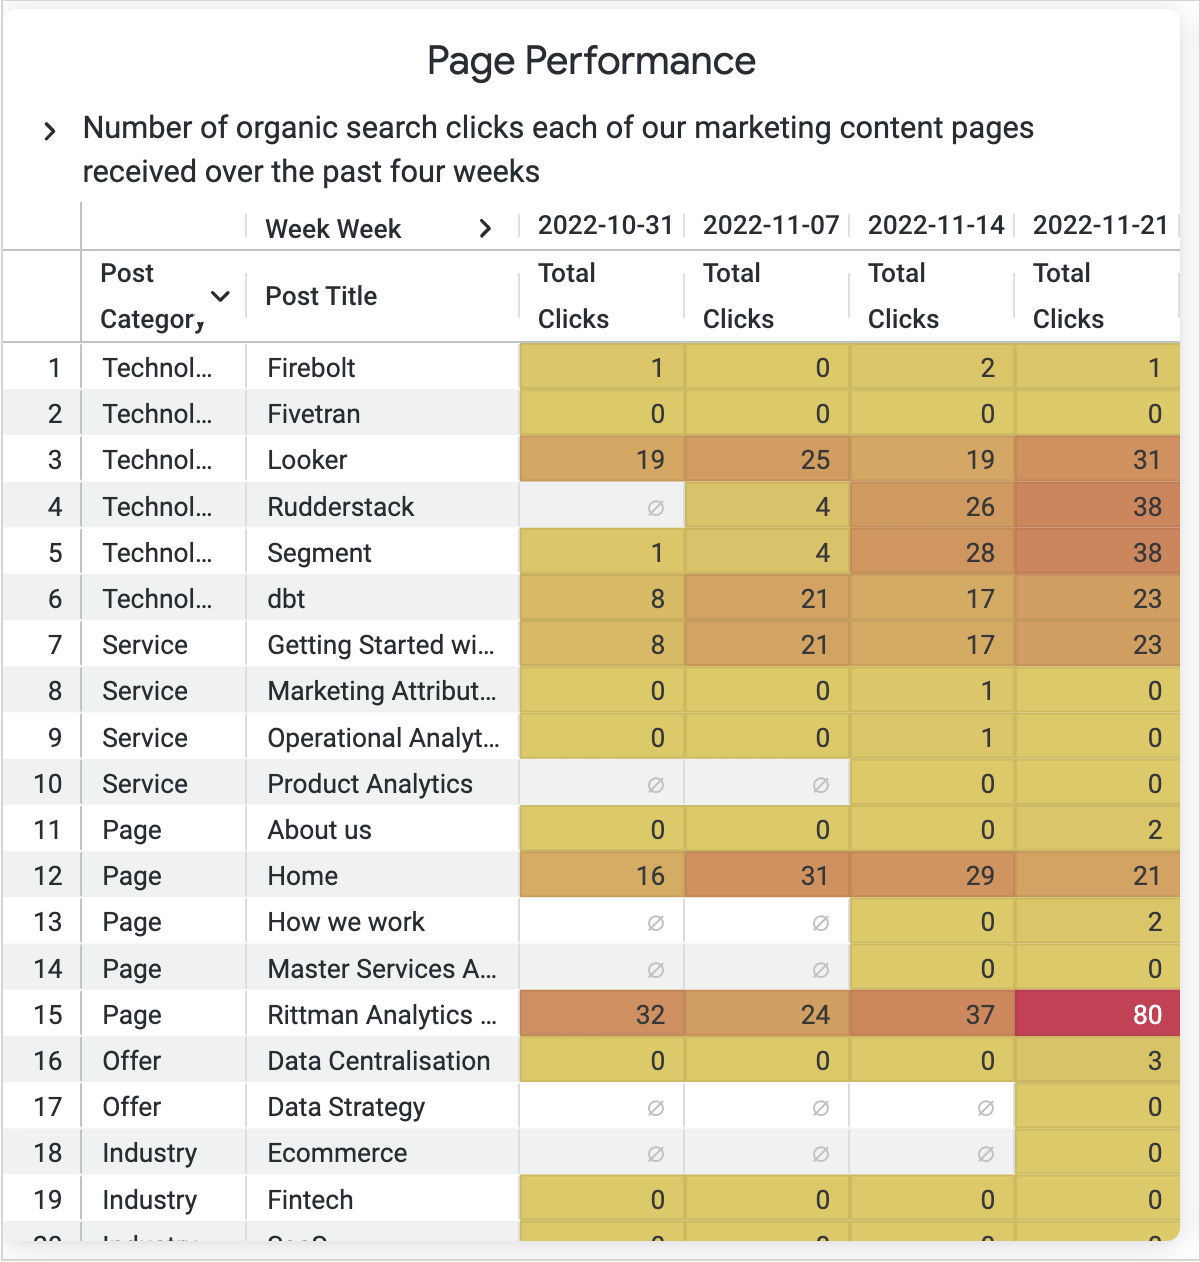
Looking at traffic volume and the amount coming from Google Search we can see an uptick beginning to start mid-way through November when we put the required changes into place, with both impressions and clicks starting to trend back to where they were before the site update and migration.
As we start to move out of “damage-rectification” mode and more into “SEO optimization”-mode, this data from Google Search Console going into our warehouse is going to be invaluable in spotting other issues, and identifying opportunities for more effective and relevant marketing.
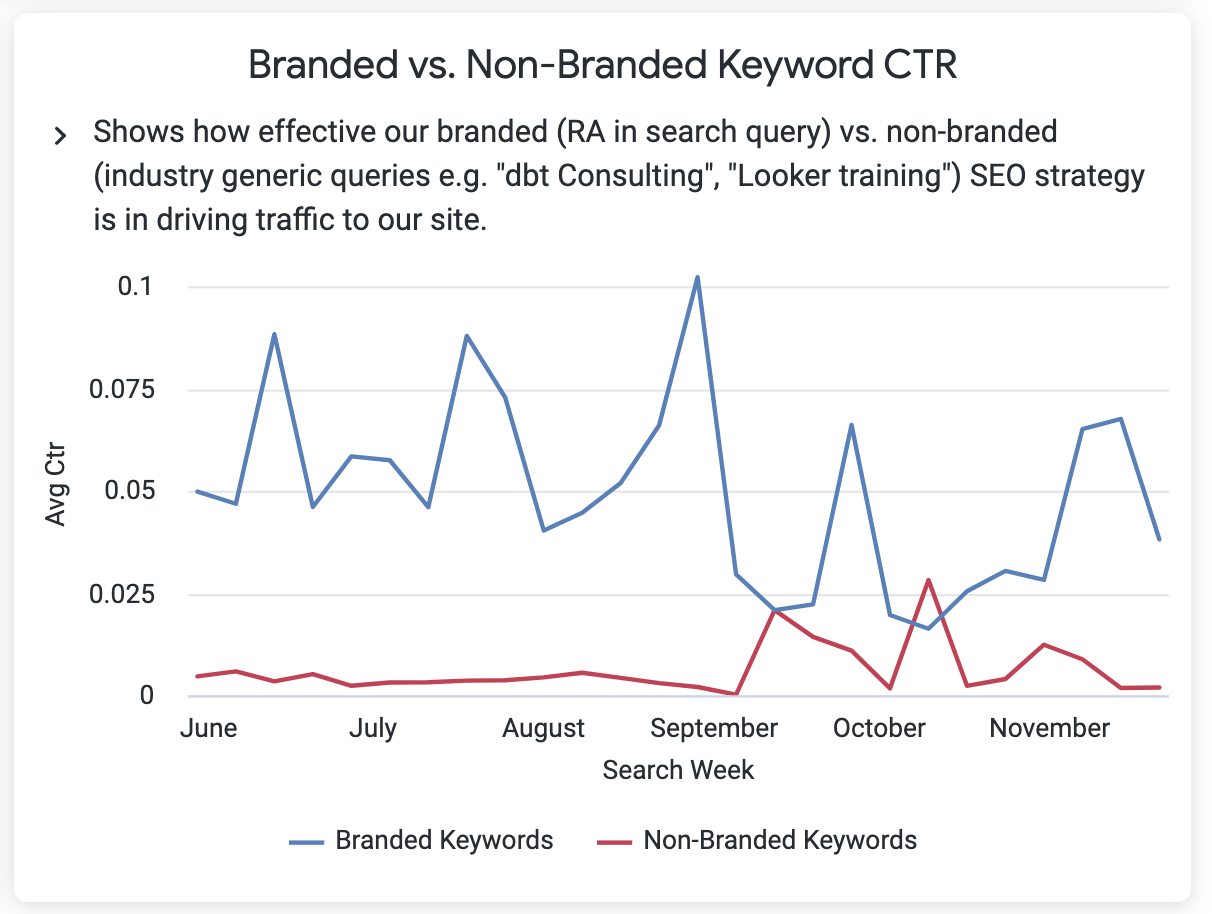
For example, splitting our search keyword click-through-rate into branded (anything with ‘rittman’ in the query keywords) and non-branded (queries such as ‘dbt metrics layer’) shows that we’ve still got some work to do to increase click-throughs on the latter.
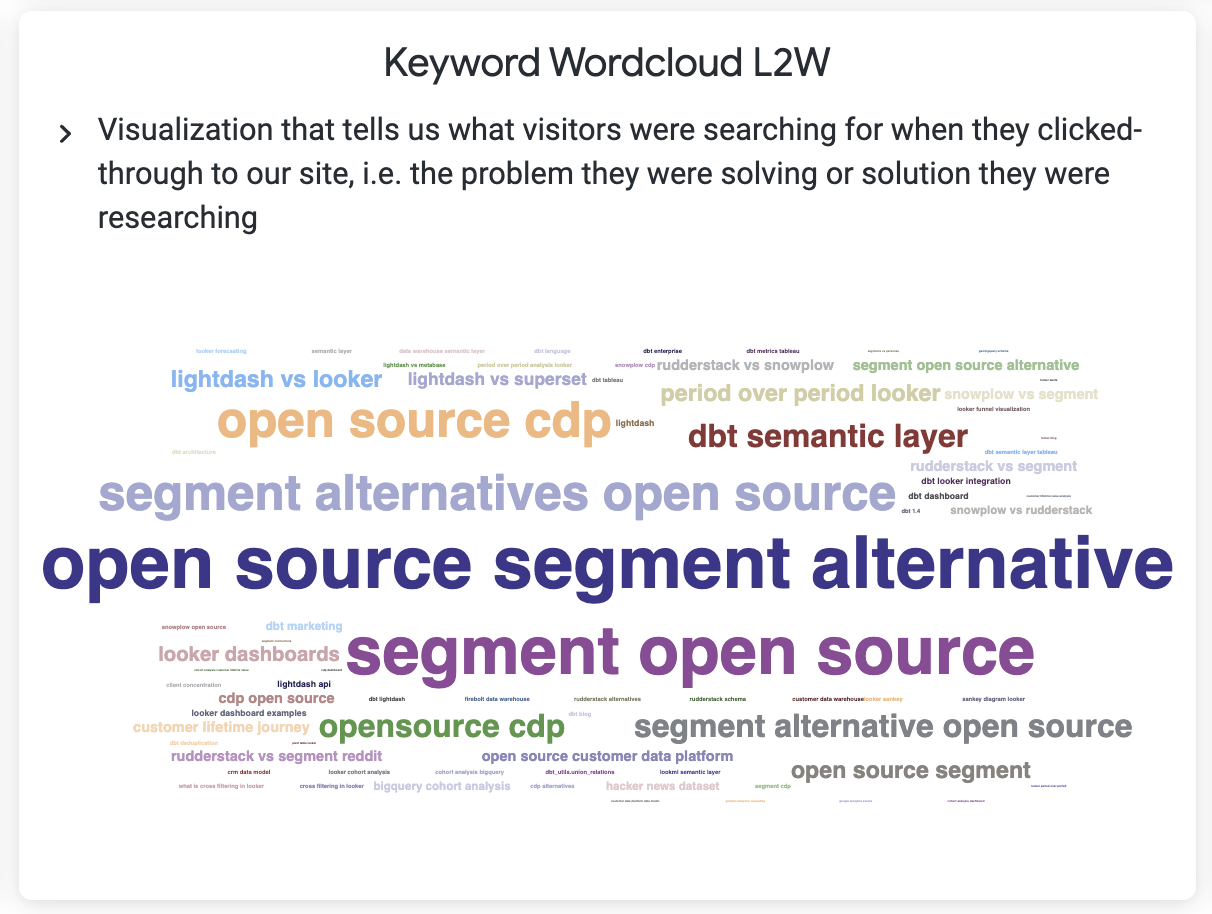
And finally, putting the set of query keywords that led to clicks to our site into a Looker word cloud visualization, for example, shows us that last week it was interest around open-source alternatives to Segment that brought visitors to our website, an insight into what’s on potential clients’ minds that we can use to better focus our marketing activity in January.
INTERESTED? FIND OUT MORE
Rittman Analytics is a boutique analytics consultancy specializing in the modern data stack who can help you centralise your data sources, optimize your marketing activity and enable your end-users and data team with best practices and a modern analytics workflow.
If you’re looking for some help and assistance understanding the impact and value delivered by your marketing activity, or to help build-out your analytics capabilities and data team using a modern, flexible and modular data stack, contact us now to organize a 100%-free, no-obligation call — we’d love to hear from you!
CEO of Rittman Analytics, host of the Drill to Detail Podcast, ex-product manager and twice company founder.
Recommended Posts
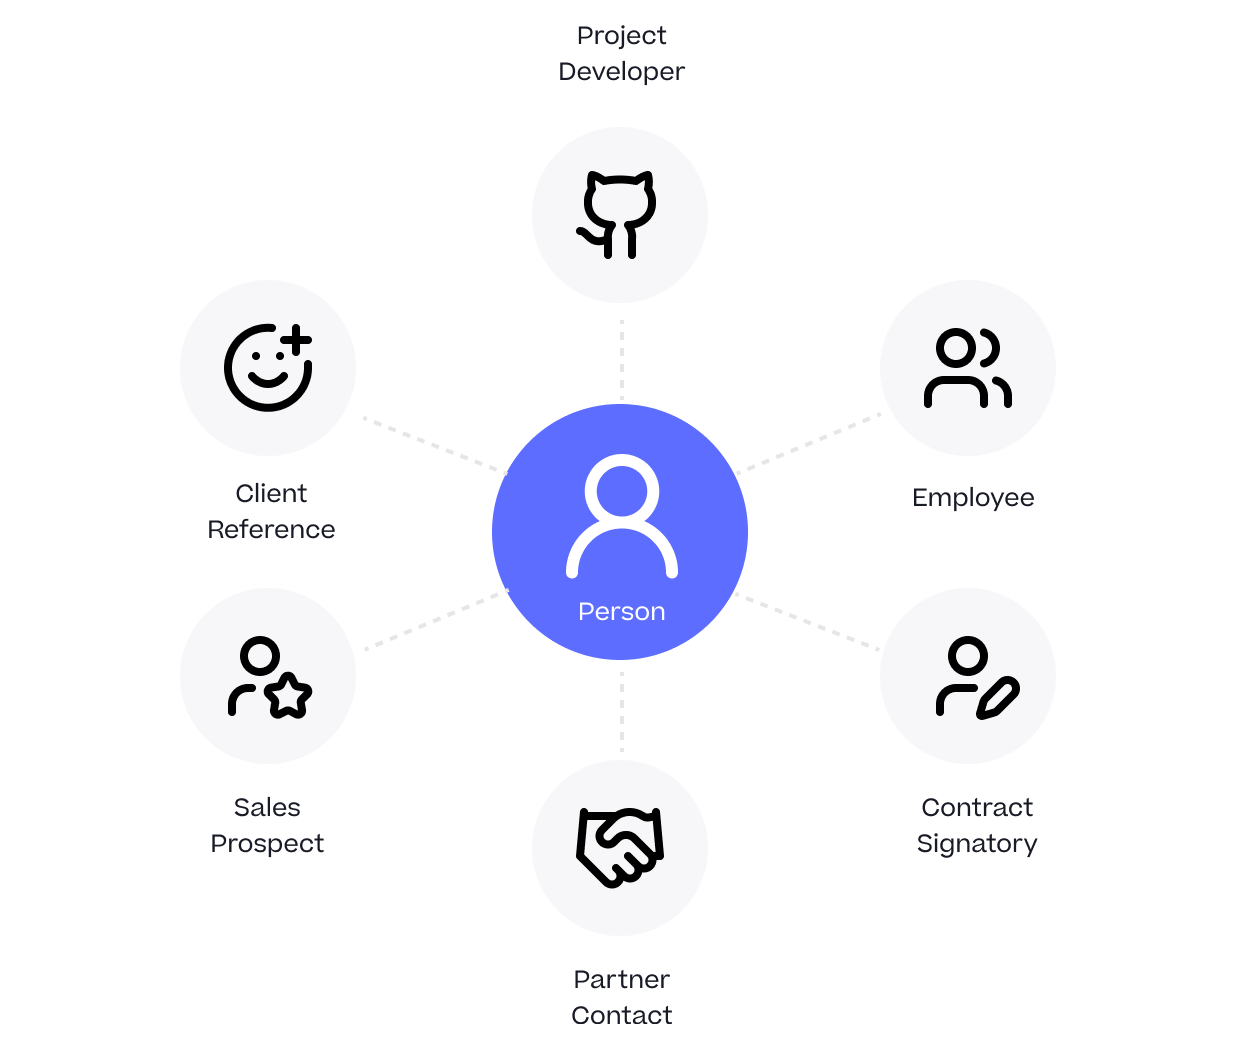
One Person Many Roles: Designing a Unified Person Dimension in Google BigQuery
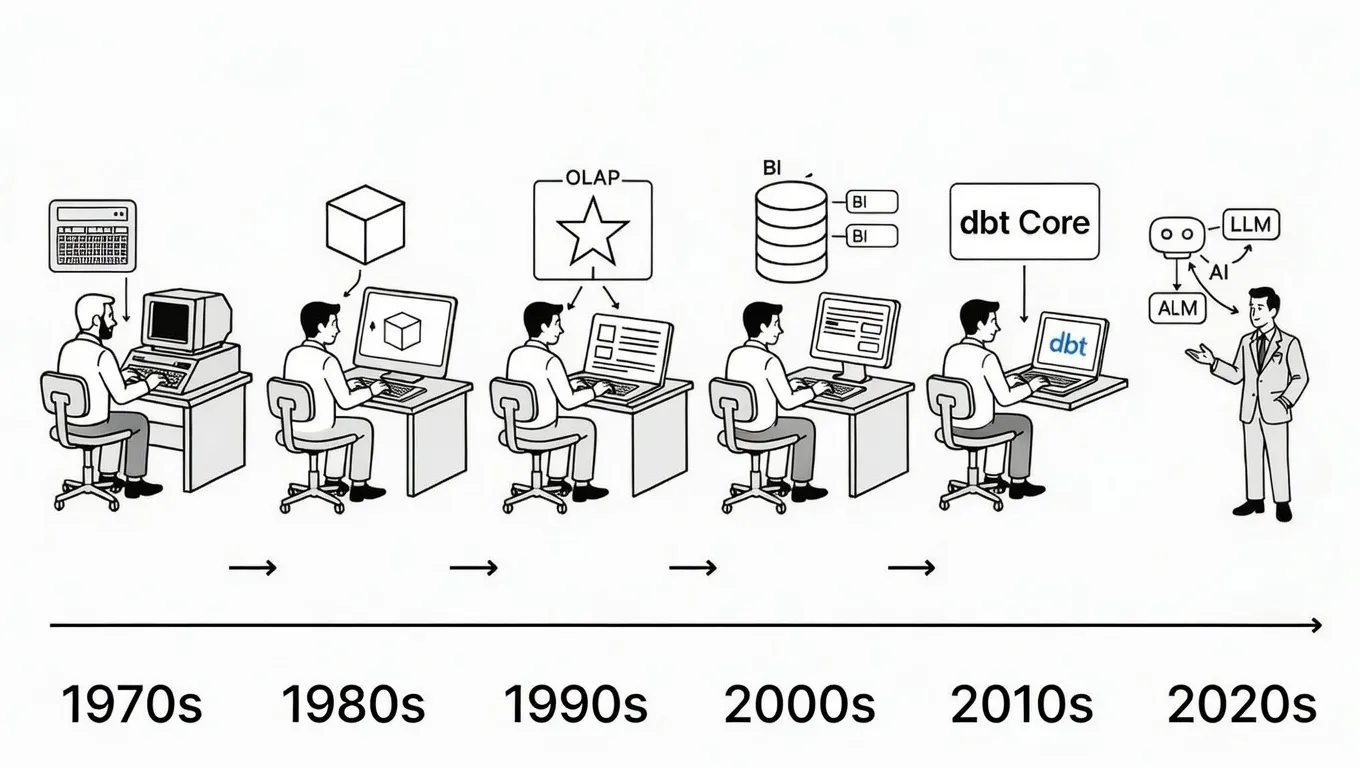
Why We’ve Tried to Replace Data Analytics Developers Every Decade Since 1974

You Probably Don’t Need an RFP