LOOKER USER ENGAGEMENT SERVICE
Are you truly maximising user engagement with Looker and Google Cloud Data Analytics within your organisation?
Level-Up Your Looker Dashboards & INCREASE USER ENGAGEMENT
Our Looker User Engagement Service is a comprehensive process that runs over three weeks to first audit, then redesign and then monitor engagement for your key Looker dashboards.
Increase adoption and usage of Looker self-service features
Improve usage and sharing of user-created content and KPIs
Add generative AI capabilities into your dashboards to automate insight
Deliver the maximum return for your investment in Google Cloud technology
DEEP DIVE
All-too often analytics and data engineers deliver analytics platforms that meet all of the business’s technical goals, but then fail to get adopted by users for reasons they can’t understand. All they know is that their cutting-edge data stacks and Looker dashboards aren’t engaging users and that’s just as much a project failure as the data pipeline being unreliable or the platform being unable to scale.
The Impact of Poor Dashboard User Experience
If you’re a CTO, CIO or Head of Data it’s essential to know if the data analytics systems you’ve rolled out are truly being used. Often, IT and Engineering teams believe their Looker dashboards are well-utilized but a quick glance at the system activity stats can reveal a different story.
Engagement often falls-away significantly post-launch, with the worst part being the fact you’re left in the dark as to why.
Almost inevitably this leads to those users going back to the desktop BI tools and personal silos of disconnected data you were trying to move away from and jeopardizing the improvements in data governance and joined-up decision-making your Google Cloud investment was based-on.
Take our Looker user engagement quiz!
Are you maximizing your Looker user engagement to its full potential?
It's important to ensure that your team has all the necessary data sources, training resources, and engagement metrics in place to make the most out of your Looker investment.
Check out this quiz to see where you stand and uncover opportunities for improvement.
SERVICE
LOOKER USER ENGAGEMENT SERVICE
Rittman Analytics’ Looker User Engagement service gives CIOs, CTOs and Heads of Data the ability to understand what changes need to be made to their Looker dashboards and reports to increase user engagement and satisfaction and provide more value to their organisation.
Just as importantly, we educate and enable your Looker developers in dashboard design and usage monitoring best practices, ensuring user engagement remains foremost in your data team’s priorities.
Audit & Analyze
Our service starts with an audit and analysis of your Looker implementation, looking for key areas that need a visual overhaul or other improvement.
After presenting the findings from this audit we then create a focused plan to address the usability issues that have the greatest impact on adoption and usage of your Looker dashboards.
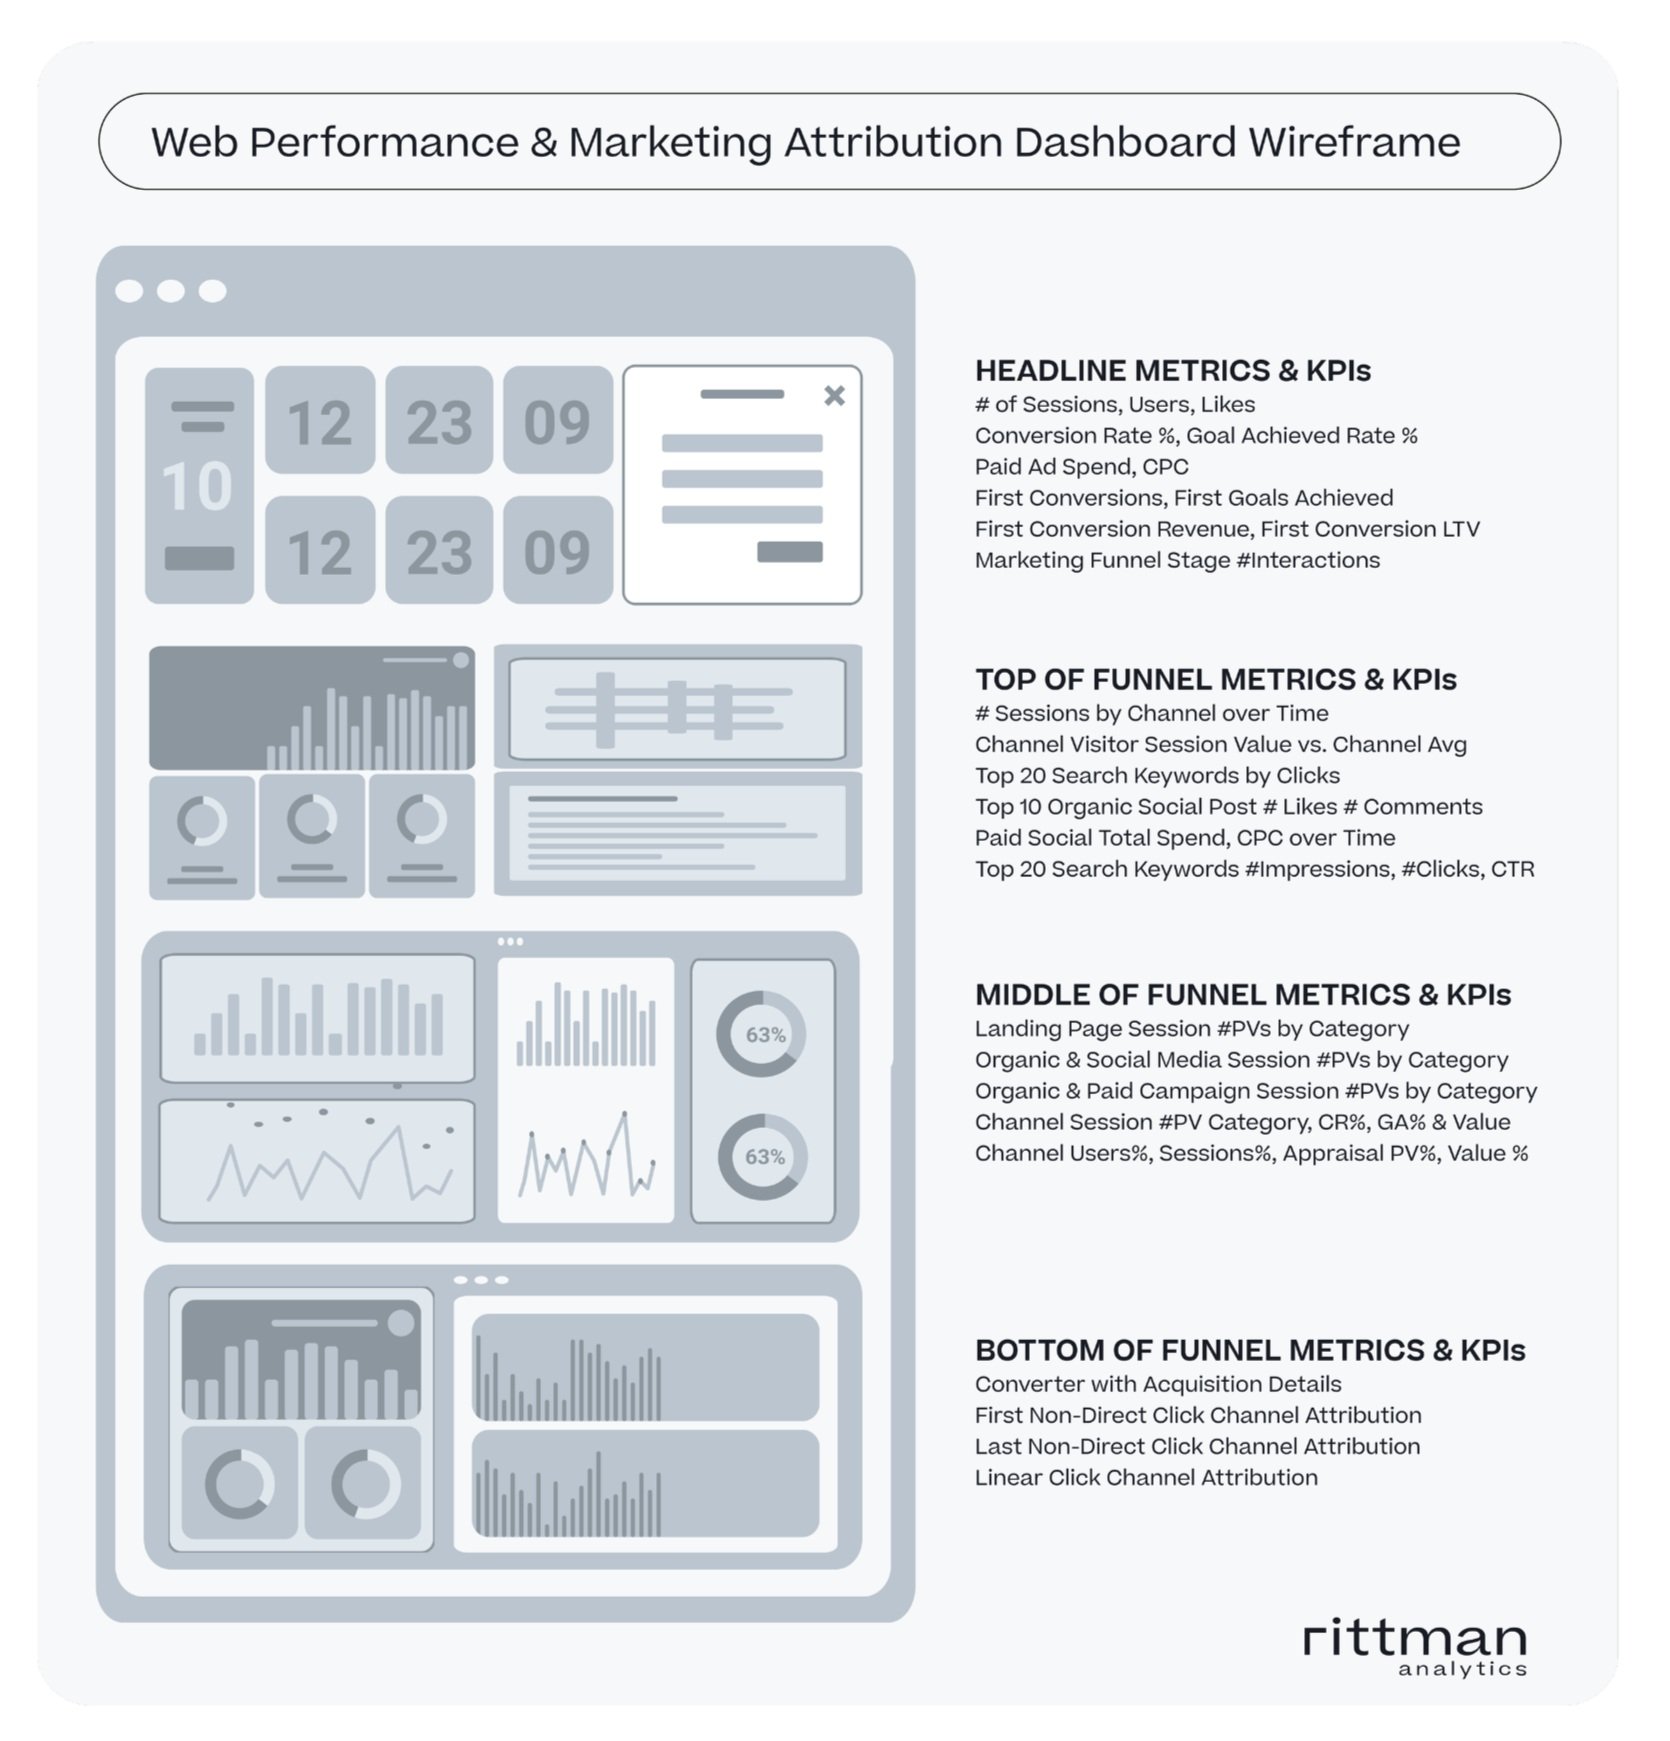
We’ll create wireframes and use tools such as Canva and Figma to help your users visualise and contribute to the final dashboard designs we’ll then focus the remainder of the engagement on.
Read our blogs on how we designed our Marketing Analytics dashboard and our Business KPIs dashboard to read more about our approach and philosophy.
Dashboard Redesign
Our service then provides a two-week time-boxed visual redesign phase to update and overhaul your most important business dashboards to increase their usability, ease of understanding and actionability.
Our team will reimagine and rebuilt your dashboards using data visualization best practices and our years of experience delivering successful Looker implementations, providing thorough training for your developers and users as we go along.
We’ll show you how to implement visualization plug-ins from the Looker Marketplace, help you implement AI features such as the Looker Explore Assistant and show you how to deliver dashboards that are customized to the particular needs of your users.
MONITOR & SUPPORT
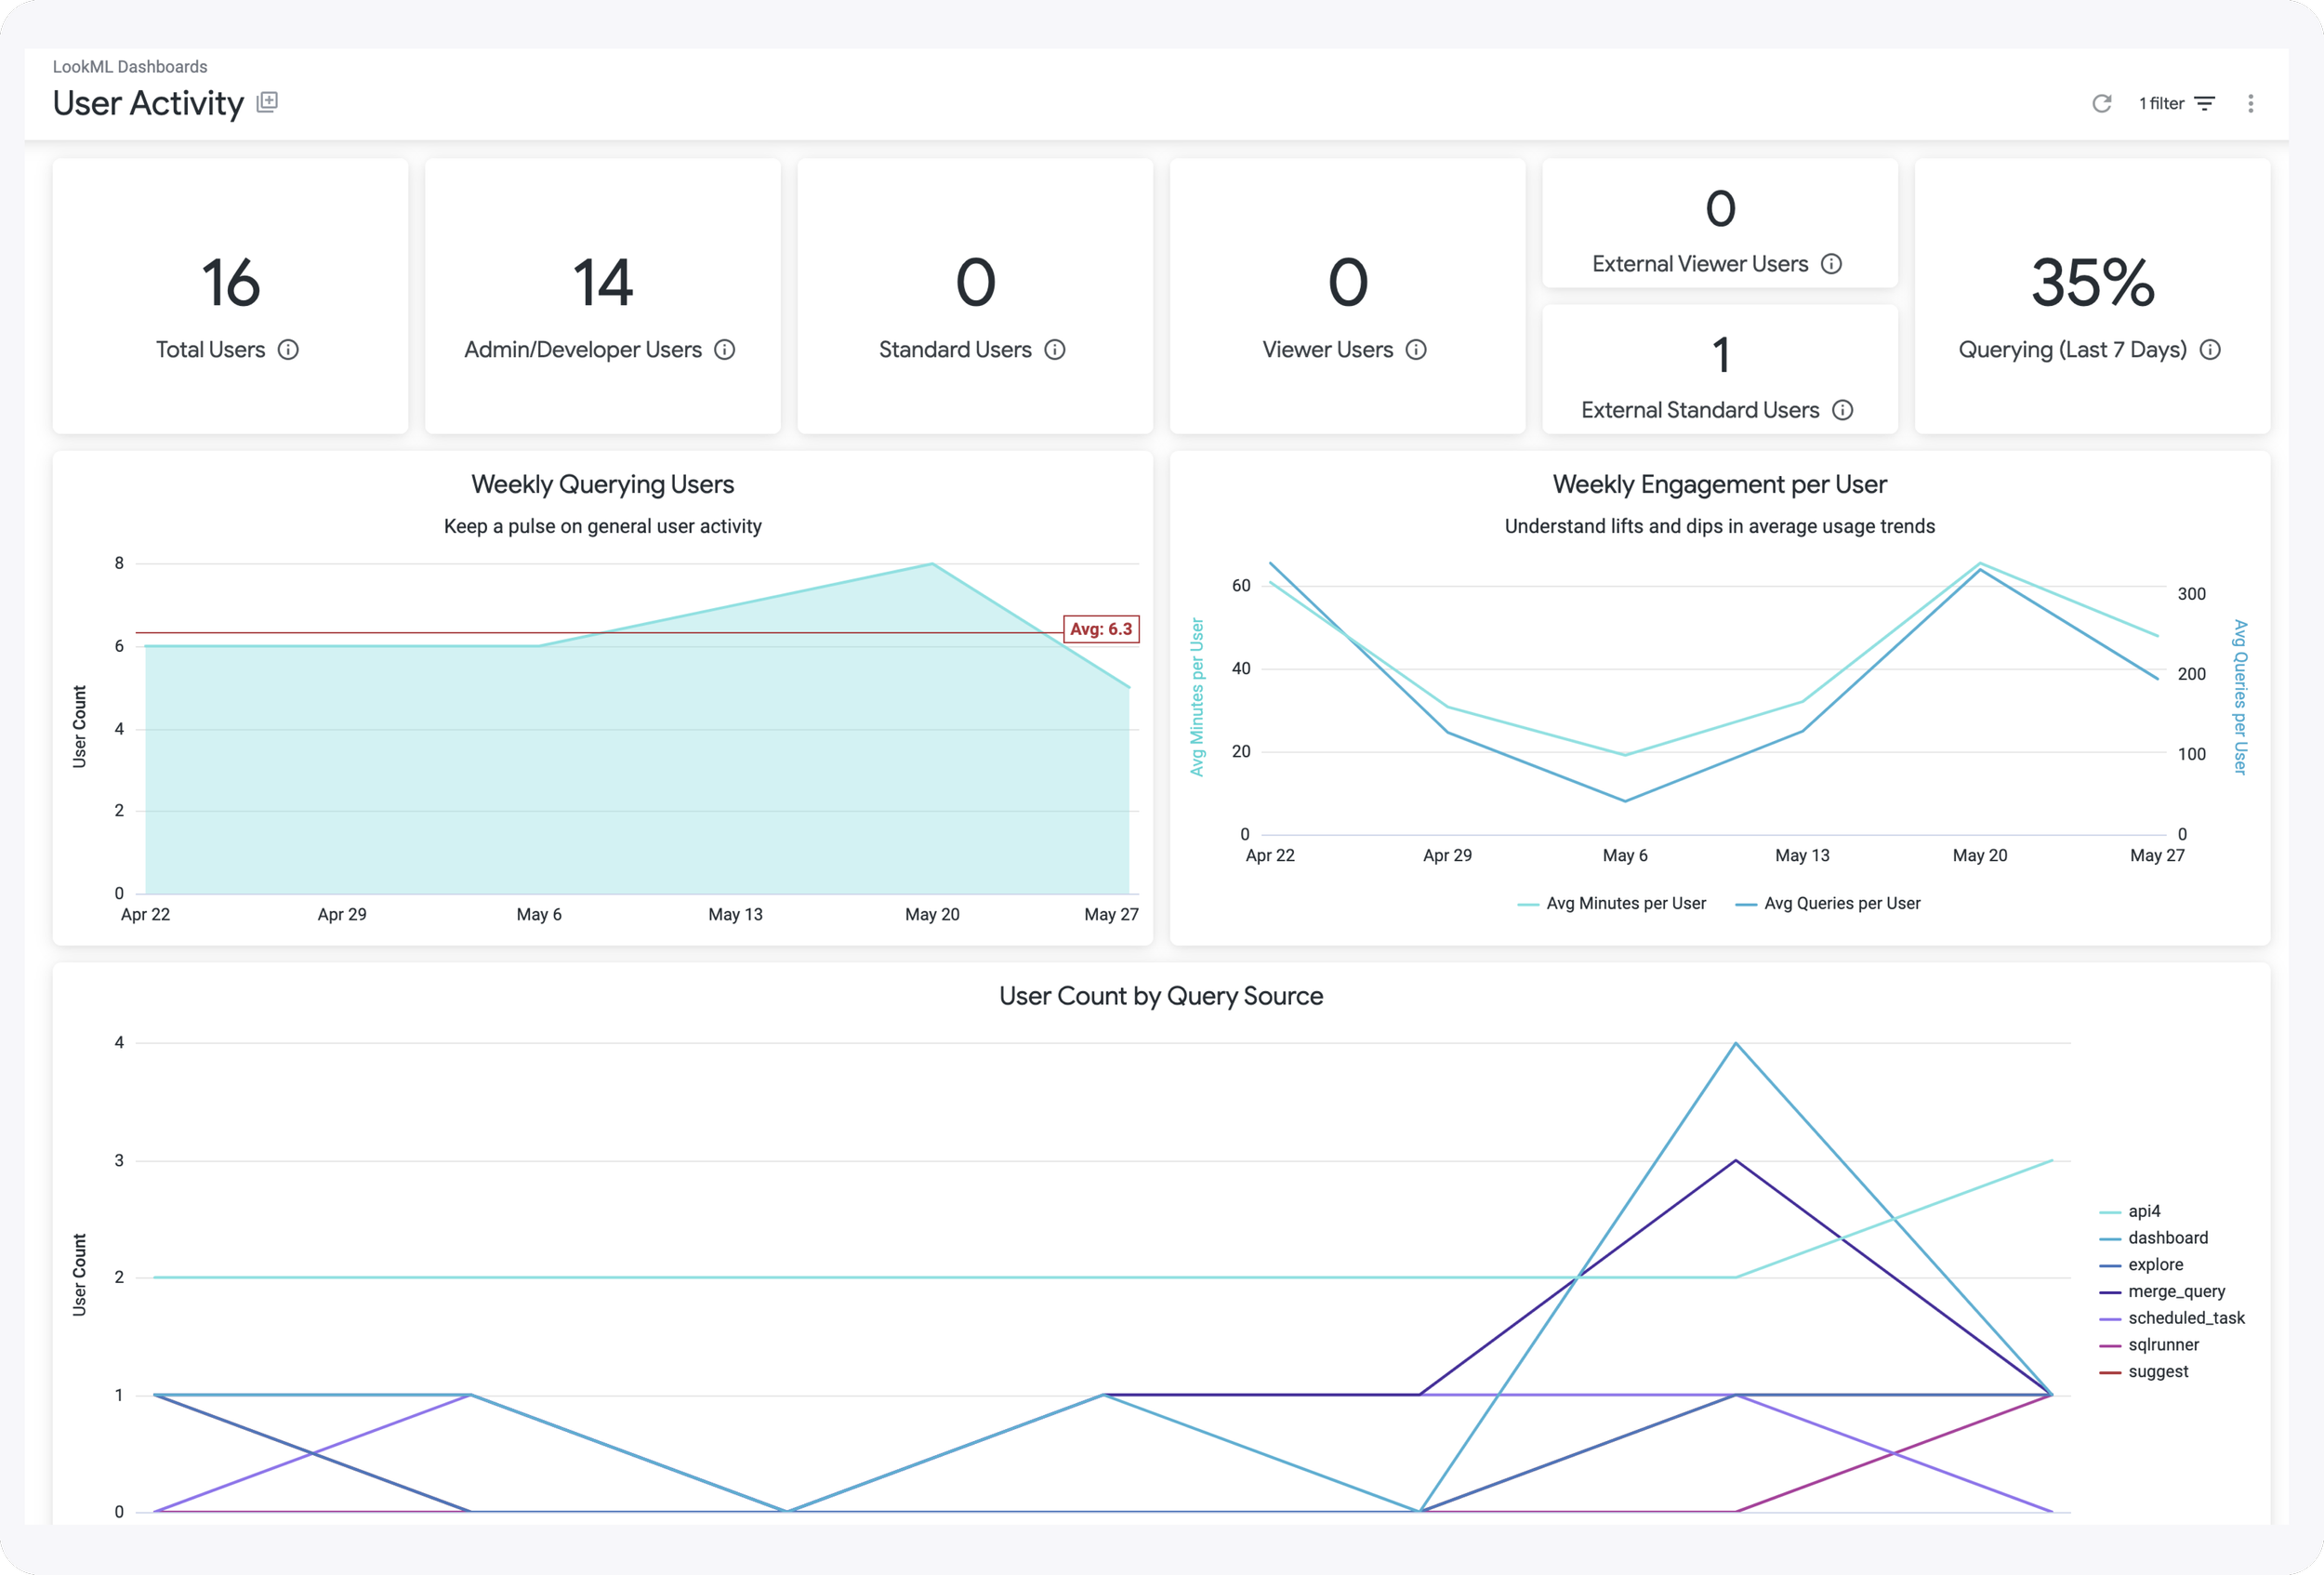
Using data from the Looker system activity explores we’ll create a user engagement dashboard that enables you to monitor the engagement KPIs that matter, tracking them over time so you can easily see how your initiatives are resonating with your users.
Read our Looker User Meetup presentation “Improve your User Engagement with Looker’s new System Activity Model”
To wrap up the service and continue to support you we can optionally provide ongoing support and training for your Looker platform as well as your wider Google Cloud Data Analytics platform.
Start Leveling-Up Your Looker Dashboards Now
Rittman Analytics is a Google Cloud Specialized Data Analytics partner with a team of Looker experts ready to help you make the most of your investment in Google Cloud Data Analytics & Looker technology.
To find-out more about this and our services for Google Cloud you can download this PDF datasheet, contact us using the button below or email us at [email protected]


