KPI Dashboards and Balanced Scorecards using Looker, dbt and Google BigQuery
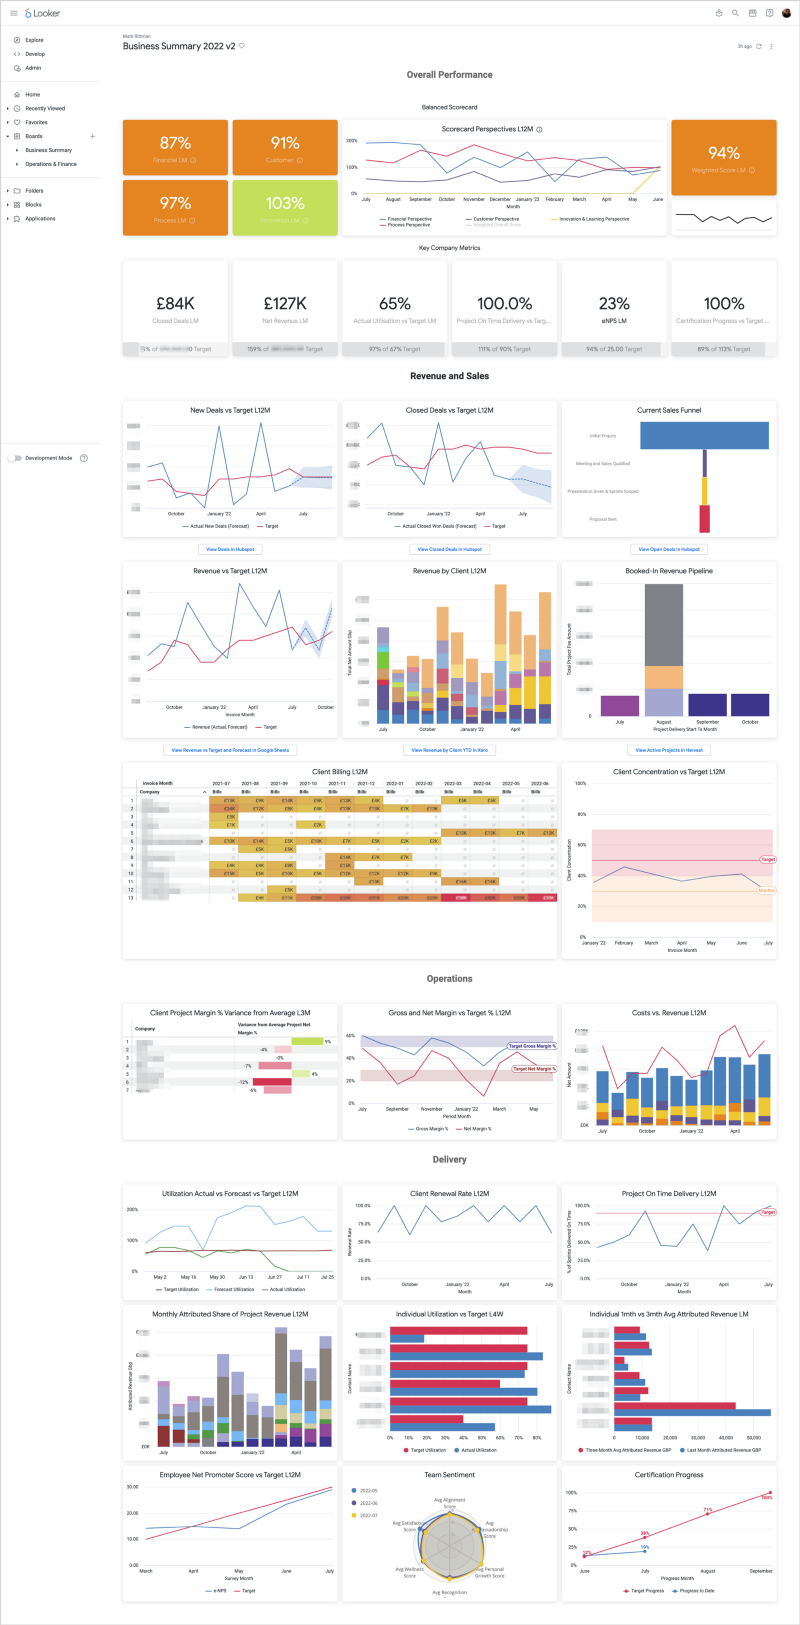
One of the main use-cases for the data stack I described in How Rittman Analytics does Analytics Part 2 : Building our Modern Data Stack using dbt, Google BigQuery, Looker, Segment and Rudderstack is to provide the data for our internal KPI dashboard shown below, built using dbt and Looker and powered by our Google BigQuery cloud data warehouse.
In previous years we used just one KPI — revenue against target — when setting goals for the team but as our business has matured and we need to consider factors beyond just revenue if we’re to make that growth sustainable; this year we adopted a more holistic approach to thinking about performance management that aimed to consider the factors that lead to revenue growth rather than just the outcome itself.
Based on the classic performance management technique first outlined in Harvard Business Review back in 1992, we started by defining overall objectives for the four perspectives of Finance, Customer, Process and Innovation by which our performance was going to be measured:
to increase revenue for the financial perspective
to increase customer satisfaction for the customer perspective
to decrease cost of delivery for our process perspective
to grow our capabilities for the innovation perspective
Each of these objectives would then have two initiatives by which we’d achieve those objectives, for example “Increase our certification level” for the “Grow our Capabilities” objective for the Innovation perspective. Some objectives for now would only have one initiative and others later on might have three or more, but one or two seemed a good starting point for now.
Then, to calculate how well we were doing at the end of each month we’d take each objective’s set of initiatives and calculate the average performance to target score for the entire set, and then calculate our overall performance score from the objective scores by applying a weighting to them reflecting their relative importance to the business over each quarter.
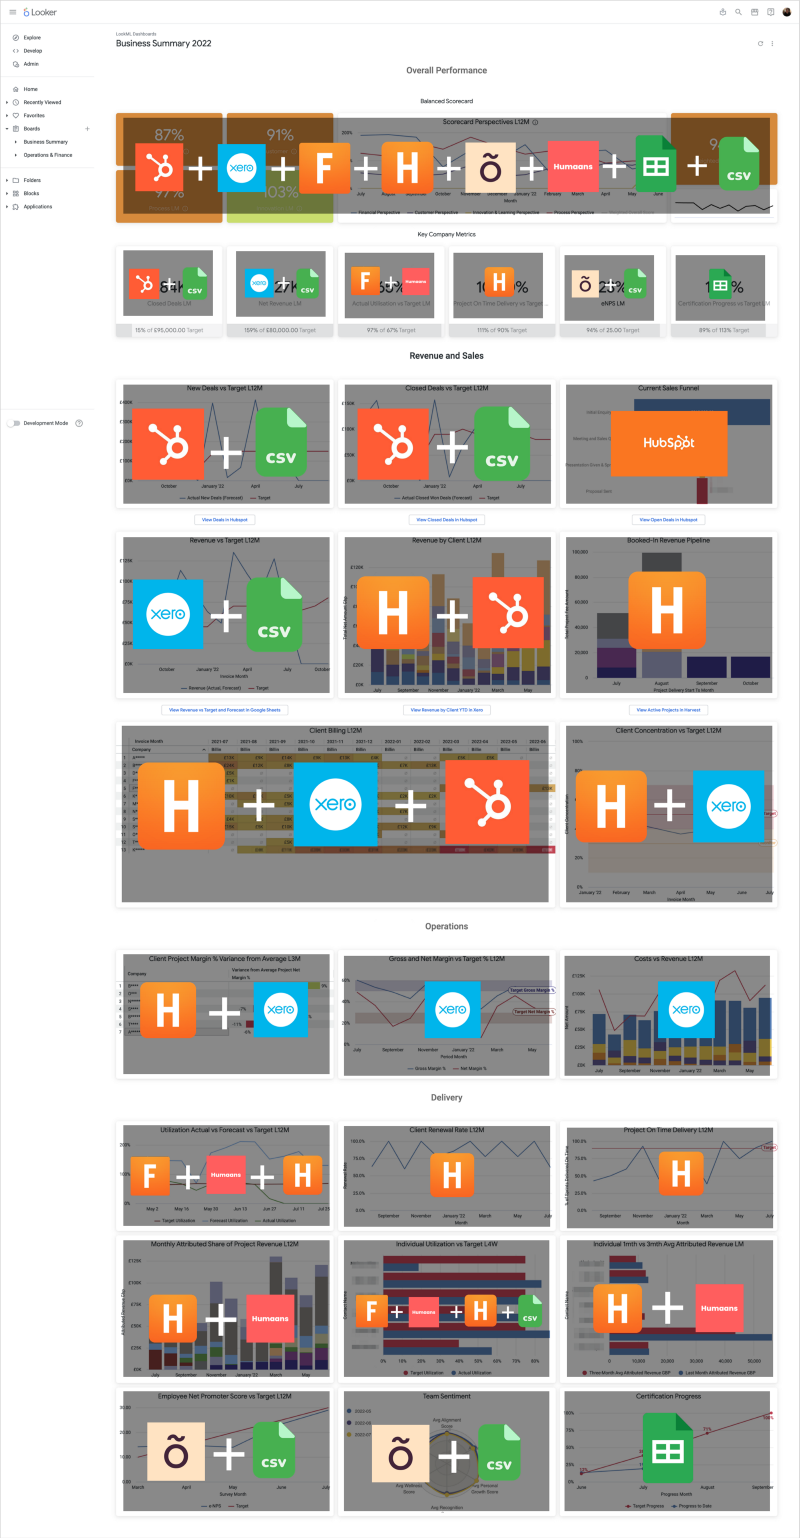
Gathering the data together for this dashboard required us combine data held across a number of the SaaS applications used to run our business; Hubspot for our CRM data, Xero for financial, Officevibe for staff surveys and Google Sheets for certification progress, for example.
As you can see from the data source overlays over the dashboard screenshot shown below, most required at least two data sources for actual and target values and some, for example the KPI and scorecard tiles at the top of the page, requiring data from up to eight separate app and file sources.
Which is where our internal data stack comes in, or at least a subset of the stack concerned with loading, transforming and combining the data we need for this particular dashboard.
Even then we still do some of that combining in the Looker reporting layer when, for example, we use the merge results feature to compare actual and forecasted new deals from one explore with the relevant target from another explore.
With the design of the dashboard, the layering of sections is intentional; at the bottom of the page are Innovation measures that show progress against target for activities that then enable the delivery (Customer) measures, which in-turn drive improvement in operational (Process) measures and finally, our financial measures.
At the top of the page are a set of metric tiles, one each for our most important KPIs, show last month’s performance compared to prior period.
As we already have those metrics in the dashboard in the form of rolling 12-month line and bar charts, we created the metric tiles by duplicating the existing ones and limiting the rows returned to just the last complete month and month before that.
Creating the scorecard tiles at the top of the page involved a bit more work; as you can’t base the calculation of one metric tile on the results of another, we had to painstakingly recreate one big merge results query to first calculate each underlying metric in-turn, then calculate the scorecard objective percentages-to-target and then finally, the weighted overall score.
Alternatively, you could extract the SQL for each of the dashboard tile queries and use them as part of a derived table LookML view that you could add to your project, reference in a standalone explore and use as the data source for the dashboard tiles directly.
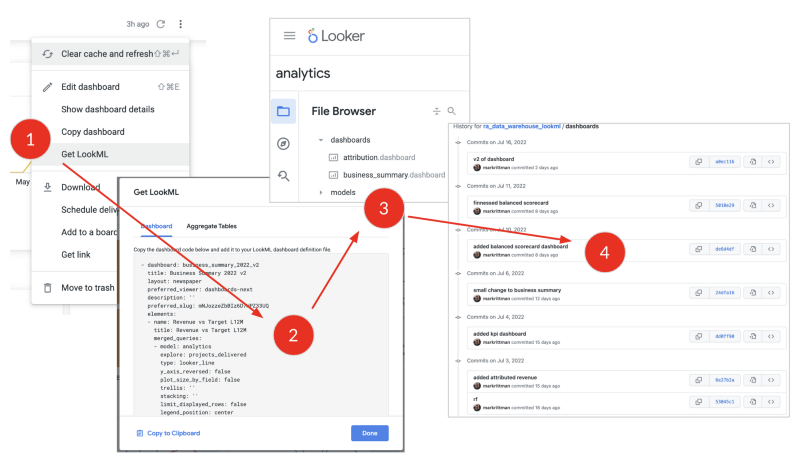
Finally, so that we could store a history of changes for this dashboard’s design and if needed, revert back to an earlier design, we exported the dashboard design as LookML and saved it alongside the LookML views and models.
The LookML version of the KPI dashboard then became the “canonical” version with the user dashboard, stored in a regular Shared Folder alongside the regular user dashboards, its design “fixed” but exportable back as a user dashboard should we wish to create a new version in the future.
Interested? Find out More
Rittman Analytics is a boutique analytics consultancy and Google Cloud Platform / Looker partner who can help you centralise your data sources, modernize your analytics and enable your end-users and data team with a modern BI workflow.
If you’re looking for some help and assistance building your own KPI dashboard in Looker or other BI tools, or to help build-out your analytics capabilities or data warehouse on a modern, flexible and modular data stack, contact us now to organize a 100%-free, no-obligation call — we’d love to hear from you!


