Using Looker to Analyze and Visualise your Customer Concentration
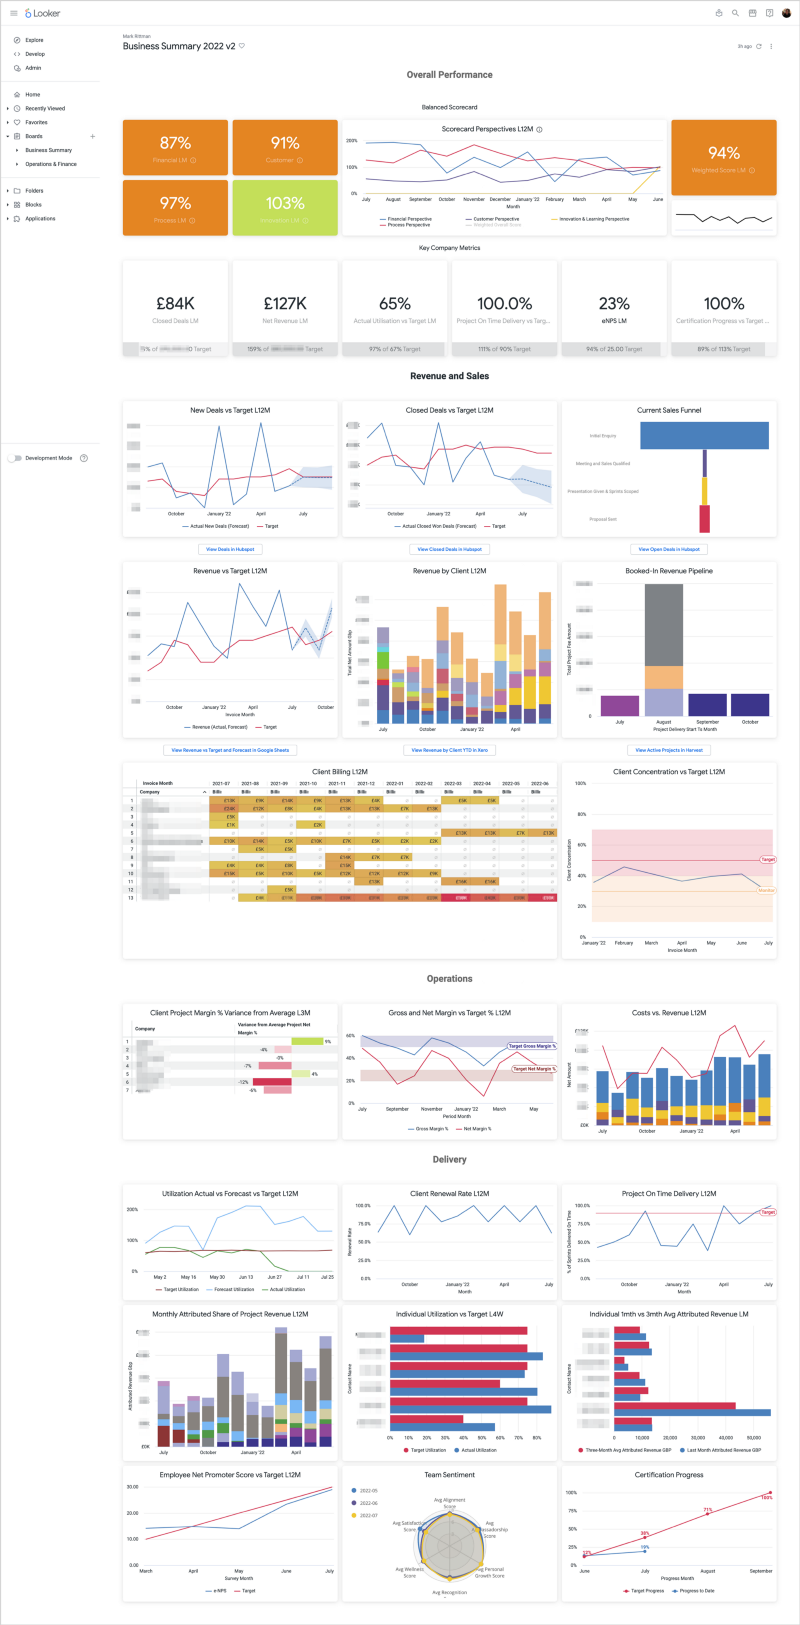
As a consultancy we monitor and visualize our customer concentration in the form of two data visualisations; one that shows our customer concentration curve and another that shows the trend of customer concentration for our business over time. In this blog I’ll explain how we do this using Looker, Google BigQuery and the modern data stack.
COVID-19 Update, Supporting the National Care Force and Analytics Consulting-as-a-Service
In this blog post I’ll talk about how we’re trying to solve the business problems we’re all facing during the coronavirus lockdown using data, analytics and the insights it can provide, and we highlight a volunteer initiative we and our partners at Looker and Segment have been helping get started in the UK, The National Care Force.


