How Rittman Analytics does Analytics: Modern BI Stack Operational Analytics using Looker, Stitch…
(First Published on the Rittman Analytics Blog, 8th May 2019)
As well as creating modern BI stack analytics solutions for clients such as Florence, Let’s Do This and Colourpop using technologies from our partners at Looker, Stitch, Segment, Fivetran and Snowflake, it’s probably no surprise that we’ve used those same technologies and project experience to build-out our own internal analytics platform, covering data and operational analytics use-cases such as
- Showing high-level KPIs that show progress towards our four main business objectives
- Providing actionable context for these high-level KPIs and the ability to drill-into the detail behind them
- Enabling ad-hoc querying and analysis of our complete dataset by technical and non-technical users
- Providing a trusted, integrated analysis-ready data platform for other internal projects
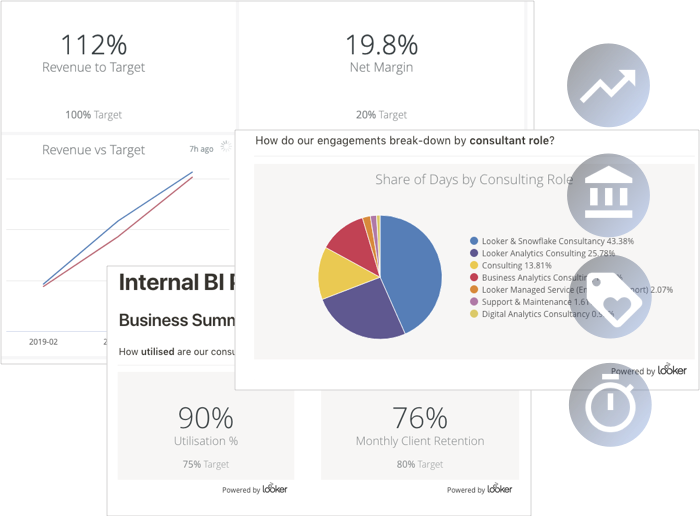
I thought it might be of interest to go through how we’ve used the tools and techniques we use for client projects but in this case to deliver an analytics solution for our own internal use, sharing some of our thinking around how we defined our underlying KPI framework, the tools and design patterns we used when building out the data management part of the platform, and some of the front-end components and data visualizations we’ve put together using the Looker BI tool.
Defining your KPI Framework
When creating any sort of analytics solution the first thing you need to understand is — what are your business objectives; what do you need to measure to understand your progress towards those objectives; and how do you then define success?
Key Performance Indicators (KPIs) and measures within our analytics platform are based around what’s needed to measure our progress towards four business objectives we set ourselves for FY2019:
- Increase Billing Revenue
- Increase Profitability
- Increase customer retention, and
- Increase our operational and delivery efficiency
In-practice, we “certify” data around these four primary KPIs and also a number of secondary measures, with data in the platform normally up-to-date as of the previous business day and with historical data going back to when we started the business.
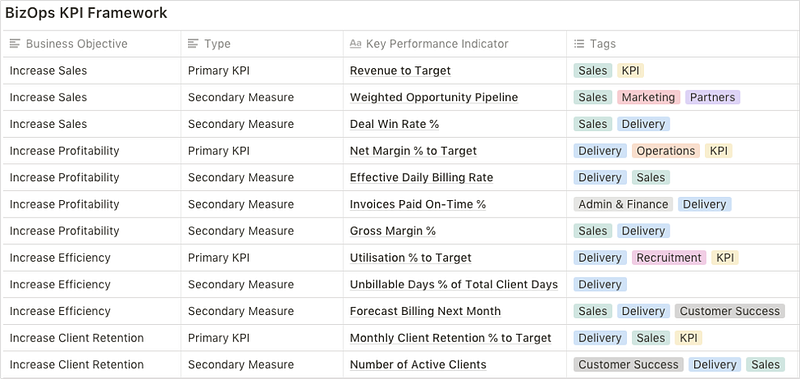
Other metrics, measures and dimension attributes are provided alongside these certified KPIs and measures and are considered “best endeavours” in terms of our certifying their accuracy, and users then of course able to create their own calculations for use in reports and analyses outside of this formal curation.
Platform Architecture
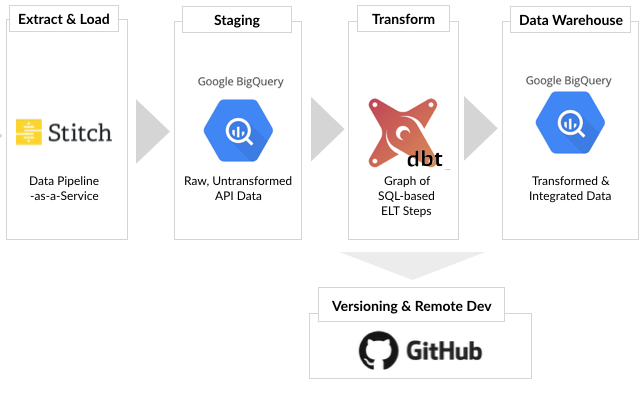
At a high-level our internal analytics platform extracts data on a regular basis from the SaaS-based services we use to run our business operations, joins that data together so that each dataset uses the same definition of clients, products and other reference data, then makes that combined dataset available for analysis as a set of business KPIs and an ad-hoc query environment.
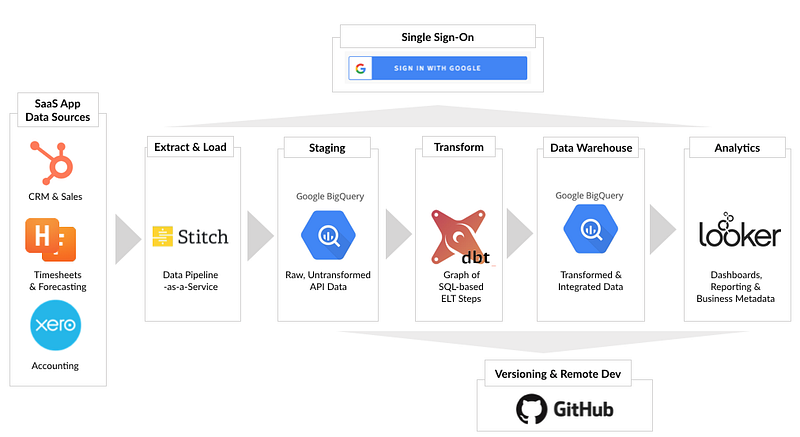
The design of our internal analytics platform was based around a modular BI technology stack, ELT (“Extract, Land and Transform”) data warehouse loading pattern and modern software development approach that we use on all of our client analytics development engagements.
Data Pipeline and Source Connectivity
We’re digital-first, paperless and run our business operations using cloud-hosted software services such as:
- Harvest for timesheets, project invoicing and client-rechargeable expenses
- Harvest Forecast for project resource planning and revenue forecasts
- Xero for accounting and payroll
- Hubspot CRM for sales and contact management
- Docusign for contract management
- Jira for project management and issue tracking
- BambooHR for human resources and recruitment
On the delivery side, Rittman Analytics partners with four different data pipeline-as-a-Service software vendors, each of which targets a different segment of the market and that segment’s particular use-cases:
- Stitch, who focus on small to mid-market startup customers with data engineers who value service extensibility and their land-and-expand pricing model ($100/month for up to five sources, including Hubspot and Xero certified and Harvest community-supported connectors)
- Fivetran, aimed more at mid-market to enterprise customers and the data analyst personas, with a more turnkey solution and increased levels of service and coverage of enterprise data sources
- Segment, more of an “enterprise service bus” for event-level digital data streams, connecting multiple event producers with downstream event consumers and offering additional features around customer journey mapping, personas and schema validation
- Supermetrics, aimed at growth hackers and digital marketers with a focus on simple self-service setup, comprehensive data dictionaries and a comprehensive catalog of advertising, marketing and social data sources delivered through a Google Sheets add-in or more recently, a direct connector into Google BigQuery through the GCP Marketplace.
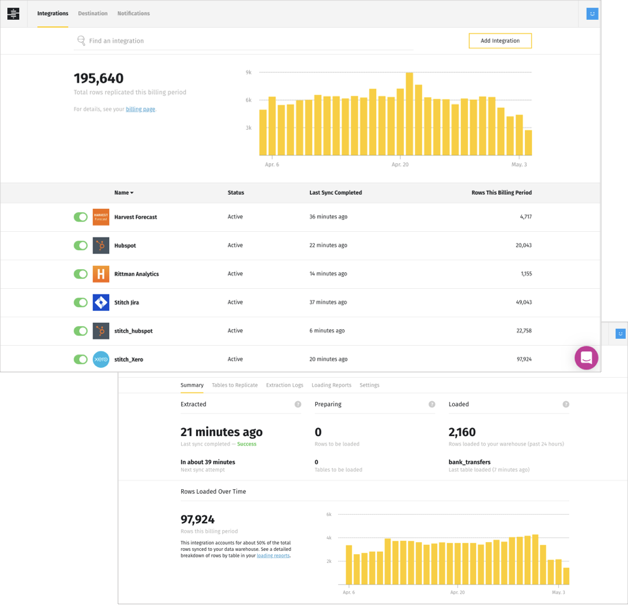
We chose to use Stitch’s service for our data pipeline for this internal project due to their out-of-the-box ability to source data from Harvest and Harvest Forecast; functionally both Fivetran and Stitch would meet our needs other than support for these two particular sources, and we’ve used Fivetran extensively on other internal and client projects in the past.
We also use Segment’s event tracking service to track visitor activity on our website and land those raw tracking events also in our BigQuery project, and intend to make use of Segment’s Personas product in due course to enable us to build out 360-degree views of our clients, site visitors and prospects based on their interactions across all of our various digital touchpoints (web, social media, inbound and outbound lead generation, chat etc)
Data Transformation, Data Integration and Orchestration
We transform and integrate raw data that Stitch syncs from each of our SaaS application sources into an integrated, query-orientated data warehouse dataset using the open-source dbt toolkit.
Once we’d decided to work with a data pipeline-as-a-service such as Stitch together with a SQL-based data management platform like Google BigQuery, the decision to transform and integrate our data via a series of SQL SELECT was the obvious next design choice; by using dbt and version-controlling our scripts in a Github repository we increased our productivity when developing these transformation, adhered to modern software design principles and avoided cut-and-paste scripting in-favour of templated, maintainable code.
Transformation steps in dbt are basically SQL SELECTs with references to metadata models replacing hard-coded table names and use of macros as reusable, often cross-database transformation components giving three main benefits over hand-written, author-specific code:
- Increased analyst productivity through leveraging libraries of best-practice transformation components
- More maintainable loading processes with concise logic that “doesn’t repeat yourself” (DRY)
- Portable code that can be deployed on BigQuery today or Snowflake tomorrow if required
For example, as shown in the example code snippet below.
SELECT
        *
    FROM (
        SELECT
            harvest_user_id,
            a.id,
            allocation,
            project_id,
            start_date,
            end_date,
            {{ dbt_utils.datediff(start_date, end_date, 'day')}} +1 AS forecast_days,
            a._sdc_sequence ,
            MAX(a._sdc_sequence) OVER (PARTITION BY a.id ORDER BY a._sdc_sequence
                RANGE BETWEEN UNBOUNDED PRECEDING AND UNBOUNDED FOLLOWING) AS latest_sdc_sequence
        FROM
            {{ ref('harvest_forecast_assignments') }} a
        INNER JOIN
            {{ ref('harvest_forecast_people') }} p
            ON person_id = p.id
        )
    WHERE
        _sdc_sequence = latest_sdc_sequence
      )
In addition to the open-source dbt toolkit we also use the commercial dbtCloud service from our friends at Fishtown Analytics, mainly in order to then be able to execute our transformation graph in the cloud, like this:
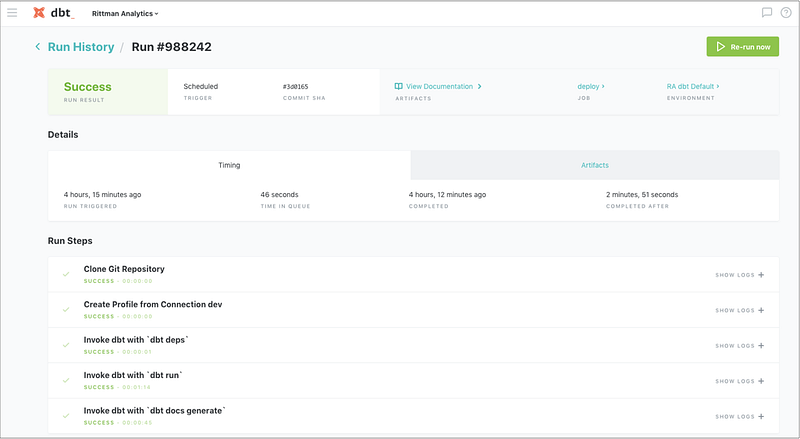
dbtCloud also hosts the data dictionary automatically generated from the metadata in our dbt package, and diagrams the transformation graph and data lineage we’ve defined through the dependencies we created between each of the models in the package.
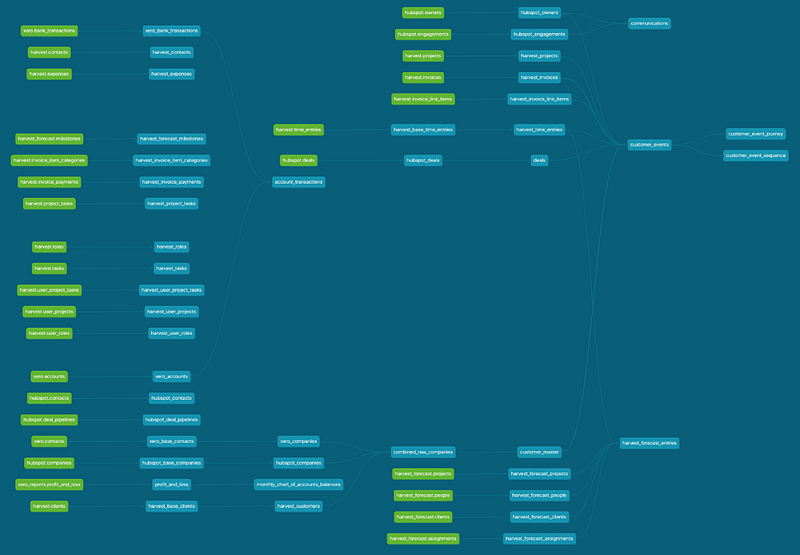
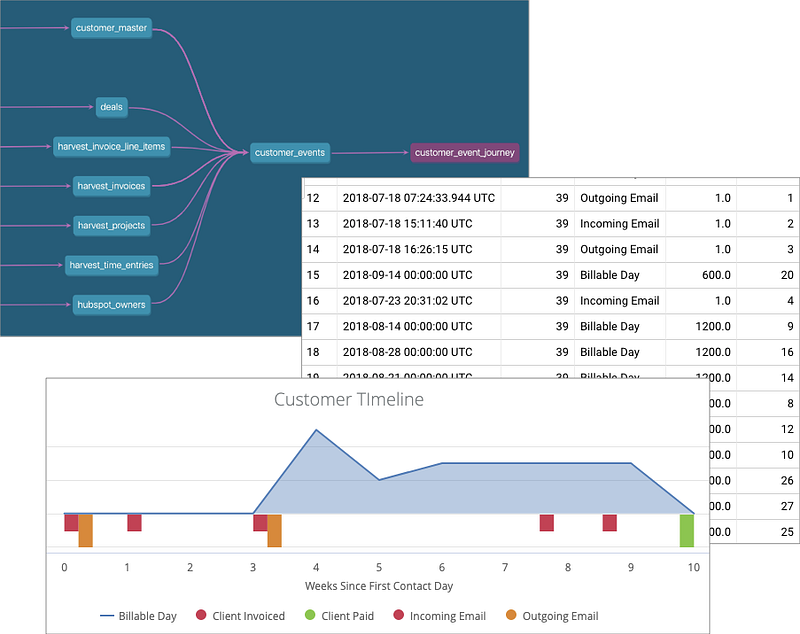
As well as standardising each data source and mapping each source’s set of customer references into a single, master customer lookup table that allows us to analyze operations from sales prospect through project delivery to invoicing and payment, we also turn every customer touchpoint into events recorded against a single view of each customer.
We then assign a financial revenue or cost value to each event in the customer journey, calculate metrics such as time between interactions (to measure engagement), value delivered to the client and use that information to better understand and segment our clients so as to provide the advice and service they’re looking for at this particular stage in their lifecycle and relationship with our team.
Analytics and Data Visualization
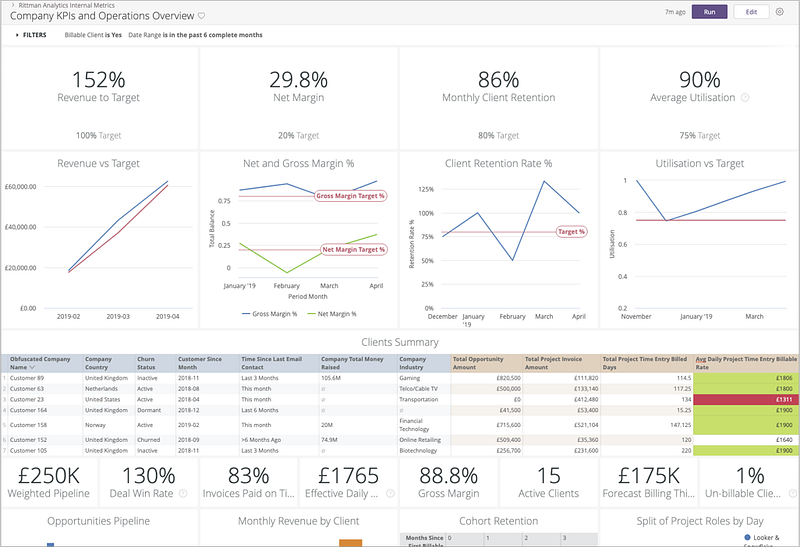
We then use Looker as our primary analytics tool over the data prepared by dbt and stored in Google BigQuery. Everyone’s homepage in Looker is set by default to show those four main operational KPIs with comparison to target and with the last six months’ trend history, providing the context when combined with Looker’s ability to go deep into the detail behind those headline numbers so that users can decide and action on what they’re seeing (note that I’ve altered and obfuscated our actual numbers in the next few screenshots)
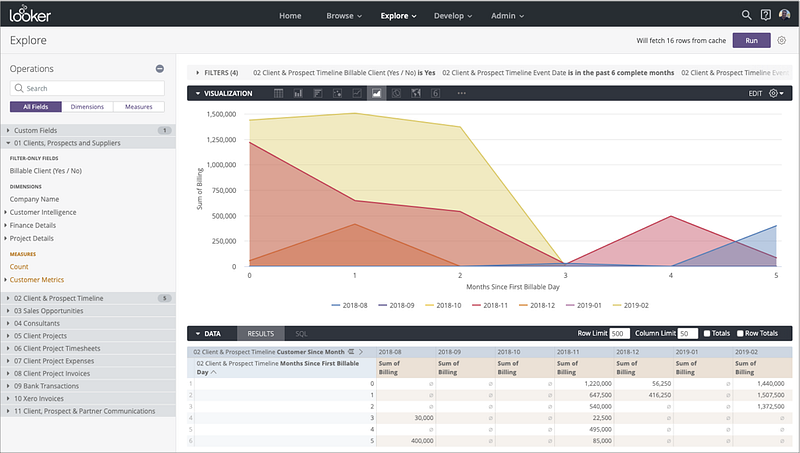
We’ve also created a single business operations-wide Looker explore that enables users to analyze and explore all aspects of our sales, delivery and financial relationship with clients, suppliers, partners and prospects.
In the example below we’ve again using the event model and applying sequencing to those events bucketed by months since first billable day, to help us understand how the the demand decay curve looks for each cohort of clients we’ve taken on over the first year we’ve been operating.
Embedded Analytics using Powered by Looker
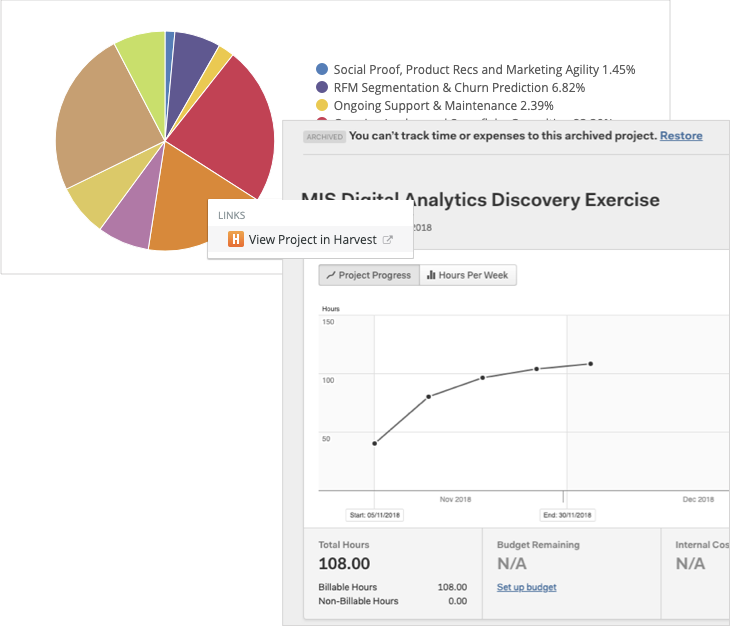
We also link fields in our Looker explore back to the online services that can provide more background detail on a metric displayed on the screen, in the example below linking back to Harvest to see details of the project displayed in the explore data visualisation.
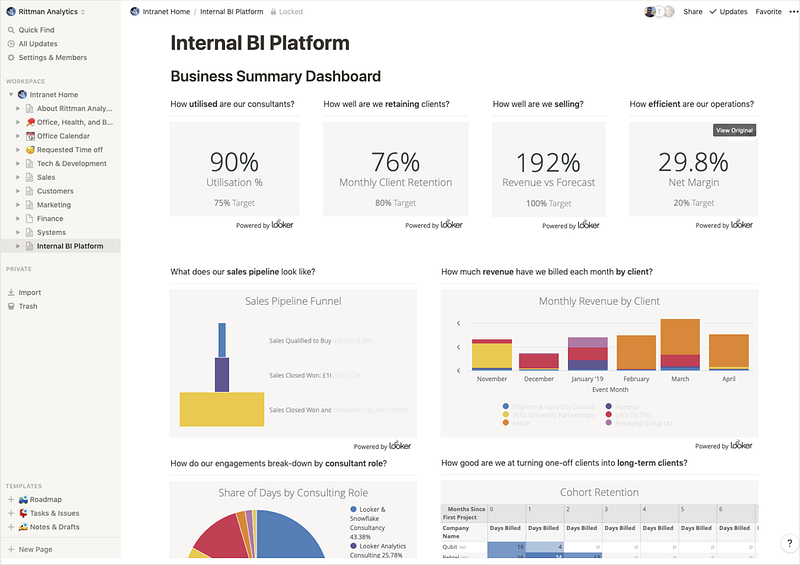
Finally, for team members who are more likely to be working within our knowledge-sharing and internal company portal site, we use Powered by Looker embedded analyics within Notion, connecting our internal analytics metrics and insights directly into the productivity and workflow tools used by the team, bringing data and analytics to the problems they’re looking to solve rather than the other way around.
So, hopefully this look behind the scenes at how we use these modern analytics stack technologies for our own analytics needs has been useful, and feel free to leave comments or contact me at mark.rittman@rittmananalytics.com if any of this would be applicable to your business. In the meantime, the dbt and Looker git repos used to build-out our platform are available as public git repos on Github:
- https://github.com/rittmananalytics/ra_dw_dbt
- https://github.com/rittmananalytics/ra_consulting_services_dw
Feel free to fork, improve on what we’ve done, submit PRs or just see a bit more of the detail behind the examples in this post.