
Looker User Engagement
Our Looker User Engagement Service is a comprehensive process that runs over three weeks to first audit, then redesign and then monitor engagement for your key Looker dashboards.
Rittman Analytics’ Looker User Engagement service gives CIOs, CTOs and Heads of Data the ability to understand what changes need to be made to their Looker dashboards and reports to increase user engagement and satisfaction and provide more value to their organisation. Just as importantly, we also educate and enable your Looker developers in dashboard design and usage monitoring best practices, ensuring user engagement remains foremost in your data team’s priorities.
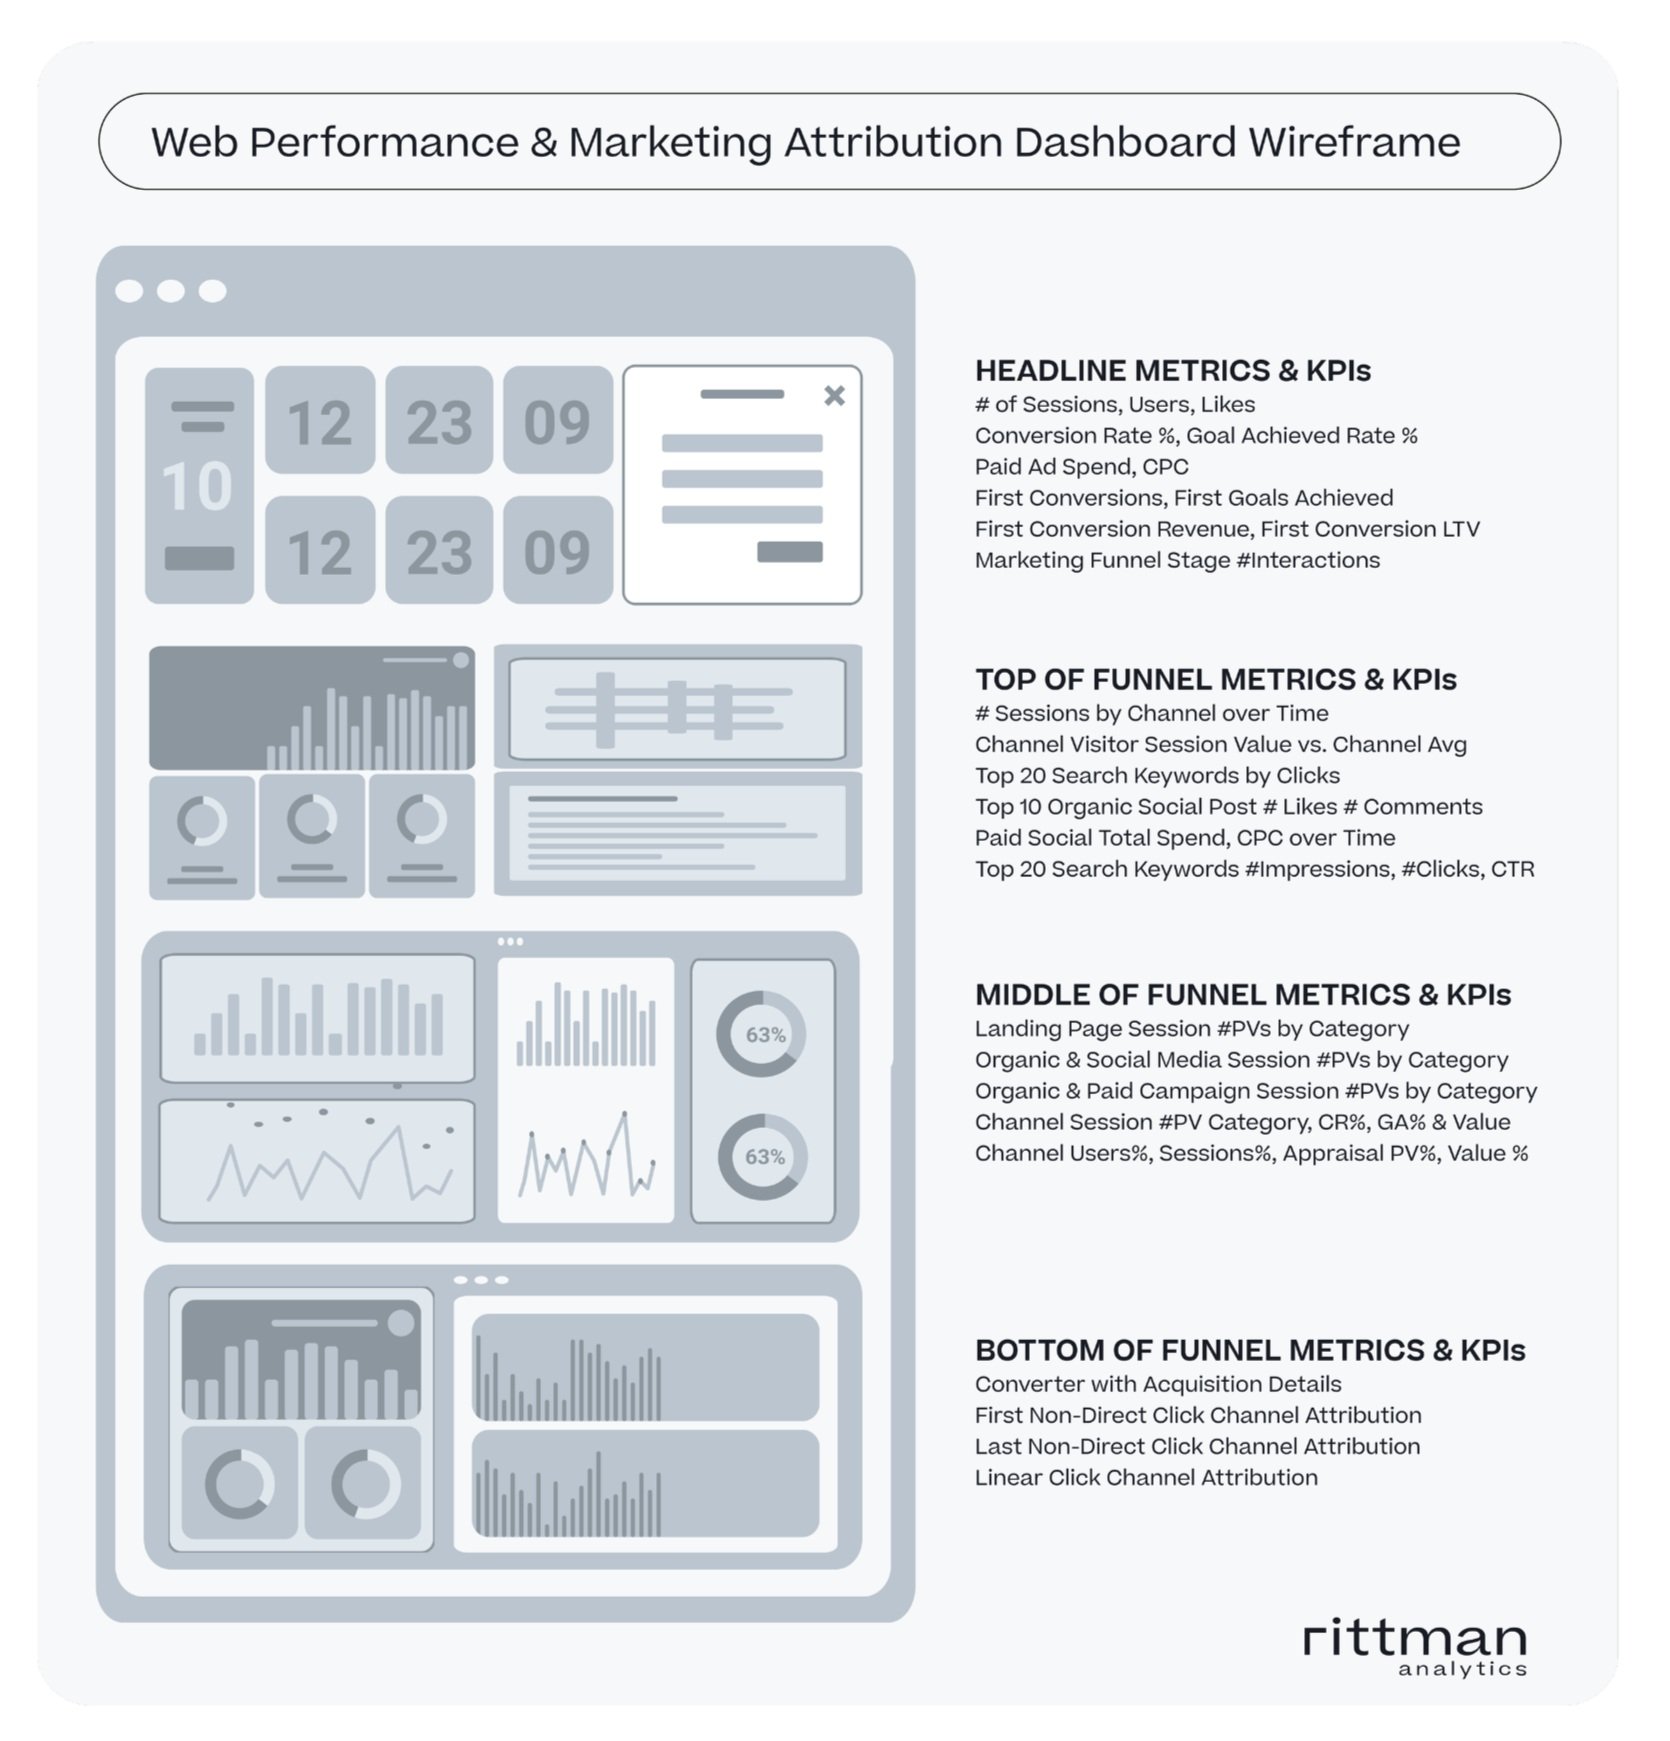
Audit & Analyze : Our service starts with an audit and analysis of your Looker implementation, looking for key areas that need a visual overhaul or other improvement. After presenting the findings from this audit we then create a focused plan to address the usability issues that have the greatest impact on adoption and usage of your Looker dashboards.
Rebuild & Redesign : Our service then provides a two-week time-boxed visual redesign phase to reimagine and rebuild your most important business dashboards using data visualization best practices to increase their usability, ease of understanding and actionability. We’ll show you how to implement visualization plug-ins from the Looker Marketplace, help you implement AI features such as the Looker Explore Assistant and show you how to deliver dashboards that are customized to the particular needs of your users.
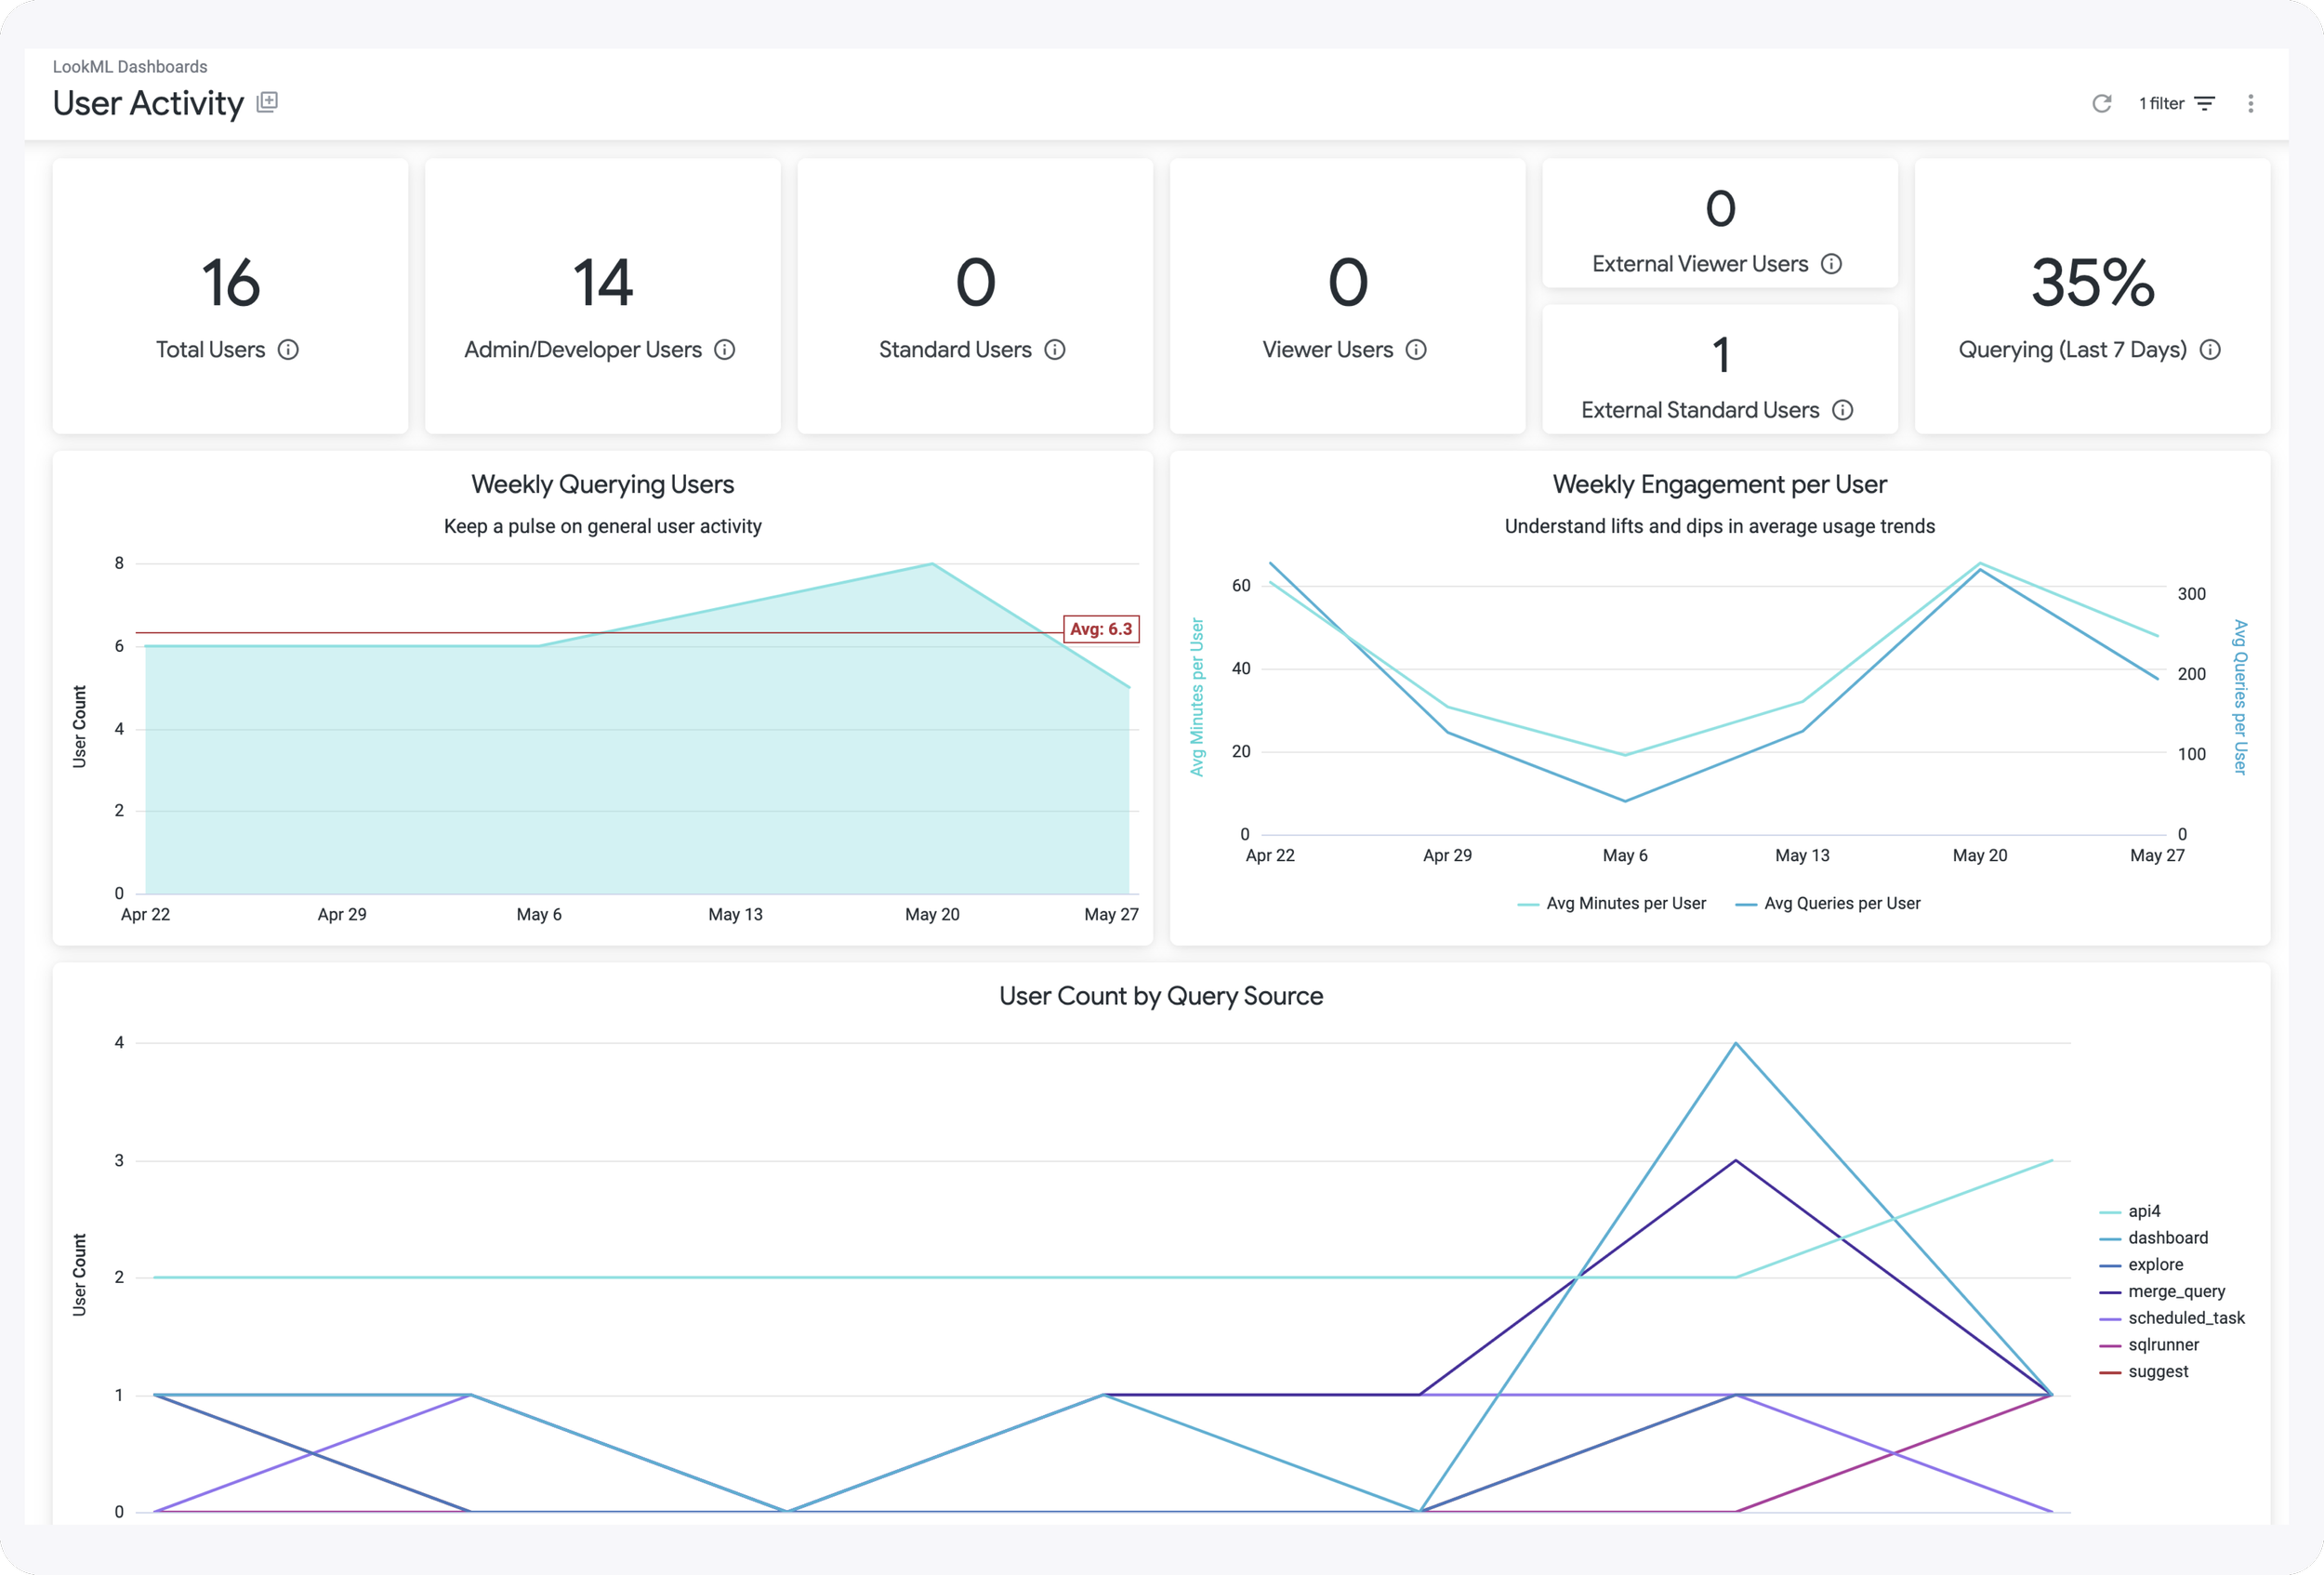
Monitor & Support : Using data from the Looker system activity explores we’ll create a user engagement dashboard that enables you to monitor the engagement KPIs that matter, tracking them over time so you can easily see how your initiatives are resonating with your users
Our Looker User Engagement Service is a comprehensive process that runs over three weeks to first audit, then redesign and then monitor engagement for your key Looker dashboards.
Rittman Analytics’ Looker User Engagement service gives CIOs, CTOs and Heads of Data the ability to understand what changes need to be made to their Looker dashboards and reports to increase user engagement and satisfaction and provide more value to their organisation. Just as importantly, we also educate and enable your Looker developers in dashboard design and usage monitoring best practices, ensuring user engagement remains foremost in your data team’s priorities.
Audit & Analyze : Our service starts with an audit and analysis of your Looker implementation, looking for key areas that need a visual overhaul or other improvement. After presenting the findings from this audit we then create a focused plan to address the usability issues that have the greatest impact on adoption and usage of your Looker dashboards.
Rebuild & Redesign : Our service then provides a two-week time-boxed visual redesign phase to reimagine and rebuild your most important business dashboards using data visualization best practices to increase their usability, ease of understanding and actionability. We’ll show you how to implement visualization plug-ins from the Looker Marketplace, help you implement AI features such as the Looker Explore Assistant and show you how to deliver dashboards that are customized to the particular needs of your users.
Monitor & Support : Using data from the Looker system activity explores we’ll create a user engagement dashboard that enables you to monitor the engagement KPIs that matter, tracking them over time so you can easily see how your initiatives are resonating with your users