Timeline Charts, Derived Tables and Analytic Functions in Looker 5
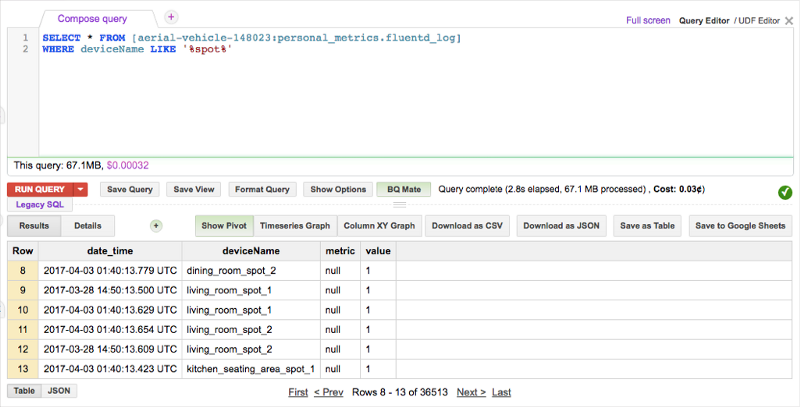
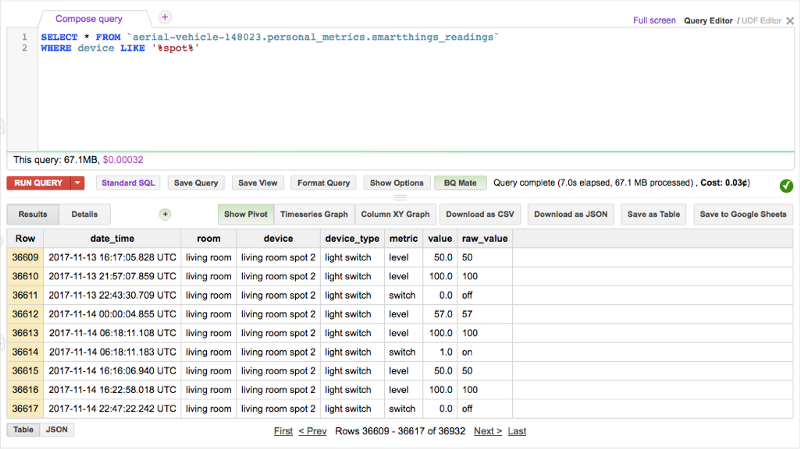
One of the data streams that comes into my personal Google BigQuery data warehouse is a record of all the Hue light switch settings and illuminance levels, Nest thermostat settings and motion sensor readings coming in via the Samsung Smart Things hub under the stairs back home. For the Hue lightbulbs I get a stream 1s and 0s that initially get stored in a four-column table in BigQuery, like this:
I then create a SQL view over that table that joins to a lookup table containing device types and room allocated for each of the devices in the data stream, and sets a metric type for each recording so that I can analyze all the thermostat readings together, bring together all the light switch settings and so on.
Its then quite straightforward to bring this SQL view into Looker and add it to the rest of the data streams I’ve brought together there so I can see, for example, whether the kitchen lights get turned-off after everyone’s gone upstairs after breakfast or whether I should try and automate those as well as my kettle.
Looker 5 introduced another way to visualize data with defined start and end events in the form of the new Timeline Chart, a feature I tweeted about the other day when I brought data on tasks from Asana into my BigQuery data warehouse via a Fivetran integration.
It’d be interesting to use this type of chart to show how one particular light switch changed from on to off and then on again over a period of time, or take all the Hue lights for a given part of the house and see whether anybody turns the lights off ever … or whether they need to be linked to the motion sensors and automatically turned-off after a period of inactivity in each room.
To use this type of chart I first need to create an “end date” field for each of my event records, so each timeline has a start and end date with other fields being optional for label and value. Looking at the list of events for the light switch I looked at earlier and ordering the events by time recorded you can see the information I need is there:
SELECT
*
FROM
`aerial-vehicle-148023.personal_metrics.smartthings_readings`
WHERE
device = 'kitchen seating area spot 1'
AND raw_value IN ('off','on')
ORDER BY
date_time
What this calls for is the LEAD BigQuery Standard SQL analytic function that returns a value based on a subsequent row to the one we’re working with, and I can combine that with the TIMESTAMP_DIFF function to compute the time between the start and end event dates as that would be useful to know too. The SQL expressions for the two new fields would therefore be:
LEAD(date_time, 1) OVER (PARTITION BY device, metric ORDER BY date_time) end_date_time,
timestamp_DIFF(LEAD(date_time, 1) OVER (PARTITION BY device, metric ORDER BY date_time),date_time,second) as value_duration_seconds
I could add these column expressions into the SQL view definition in BigQuery and order the rows by device, metric and timestamp, like this:
SELECT
date_time as date_time,
device as device,
metric,
value,
raw_value,
LEAD(date_time, 1) OVER (PARTITION BY device, metric ORDER BY date_time) as end_date_time,
timestamp_DIFF(LEAD(date_time, 1) OVER (PARTITION BY device, metric ORDER BY date_time),date_time,second) as value_duration_seconds
from `aerial-vehicle-148023.personal_metrics.smartthings_readings`
where device = 'kitchen seating area spot 1'
and metric = 'switch'
and raw_value in ('on','off')
order by 2,3,1
Executing that SQL shows the logic is working, but I’d then have to maintain that view within BigQuery and that might not be the most convenient place to add new code.
Instead, I could just go into Looker and create a new view there based on a derived table SQL expression and do the work there. Right now my LookML model looks like the excerpt below, where you can see the sensor readings view joined into the rest of the explore so all my data can be analyzed together.
connection: "rittman_bigquery"
include: "*.view.lkml" # include all views in this project
include: "*.dashboard.lookml" # include all dashboards in this project
explore: date_dim {
case_sensitive: no
label: "Data Warehouse"
join: fluentd_transactions {
type: left_outer
sql_on: ${date_dim.date_minute5} = ${fluentd_transactions.date_minute5} ;;
relationship: many_to_many
}
join: smartthings_readings {
type: left_outer
sql_on: ${date_dim.date_minute5} = ${smartthings_readings.date_minute5} ;;
relationship: one_to_many
}
join: fluentd_uber_rides {
type: left_outer
sql_on: ${date_dim.date_minute5} = ${fluentd_uber_rides.date_minute5} ;;
relationship: many_to_many
}
}
I now create a new LookML view that uses a derived table SQL query as the view definition rather than simply referencing an existing BigQuery table. Note how I’ve used the same view_label as the main LookML view containing my event data, so that the dimensions and metric I define here appear alongside all the other smart device fields the same explore view.
view: device_event_end_and_timespan {
view_label: "6 - Smart Devices"
derived_table: {
sql: SELECT
date_time as date_time,
device as device,
metric as metric,
LEAD(date_time, 1) OVER (PARTITION BY device, metric ORDER BY date_time) as end_date_time,
timestamp_DIFF(LEAD(date_time, 1) OVER (PARTITION BY device, metric ORDER BY date_time),date_time,second) as value_duration_seconds
from `aerial-vehicle-148023.personal_metrics.smartthings_readings`
order by 2,3,1;;
}
dimension: date_time {
type: date_time
hidden: yes
sql: ${TABLE}.date_time ;;
}
dimension: device {
type: string
hidden: yes
sql: ${TABLE}.device ;;
}
dimension: metric {
type: string
hidden: yes
sql: ${TABLE}.metric ;;
}
dimension_group: end_date_time {
group_label: "End Date"
label: "End"
type: time
timeframes: [
raw,
time,
hour,
hour3,
hour4,
hour6,
hour12,
hour_of_day,
time_of_day,
minute,
minute5,
minute10,
minute15,
minute30,
day_of_week,
day_of_month,
day_of_year,
date,
week,
week_of_year,
month,
month_name,
month_num,
quarter,
year
]
sql: ${TABLE}.end_date_time ;;
}
dimension: pk {
primary_key: yes
hidden: yes
type: string
sql: concat(cast(${TABLE}.start_date_time as string), ${TABLE}.device) ;;
}
measure: value_duration_seconds {
type: average
sql: ${TABLE}.value_duration_seconds ;;
}
}
Then I join this derived table view back into the explore within my LookML model, as below:
connection: "rittman_bigquery"
include: "*.view.lkml" # include all views in this project
include: "*.dashboard.lookml" # include all dashboards in this project
explore: date_dim {
case_sensitive: no
label: "Data Warehouse"
join: fluentd_transactions {
type: left_outer
sql_on: ${date_dim.date_minute5} = ${fluentd_transactions.date_minute5} ;;
relationship: many_to_many
}
join: smartthings_readings {
type: left_outer
sql_on: ${date_dim.date_minute5} = ${smartthings_readings.date_minute5} ;;
relationship: one_to_many
}
join: device_event_end_and_timespan {
type: left_outer
sql_on: ${smartthings_readings.date_time} = ${device_event_end_and_timespan.date_time} and
${smartthings_readings.device} = ${device_event_end_and_timespan.device} and
${smartthings_readings.metric} = ${device_event_end_and_timespan.metric};;
relationship: one_to_one
}
join: fluentd_uber_rides {
type: left_outer
sql_on: ${date_dim.date_minute5} = ${fluentd_uber_rides.date_minute5} ;;
relationship: many_to_many
}
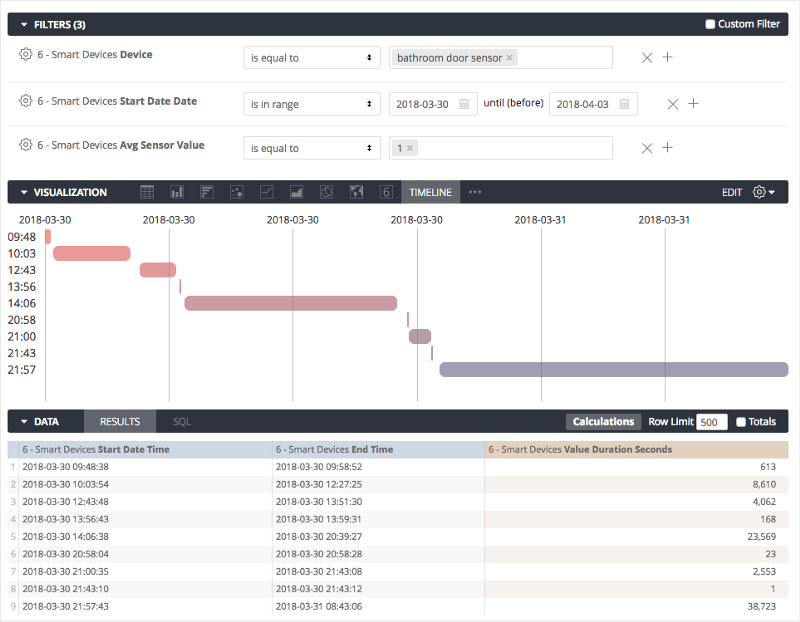
and now I can create timeline charts that show me which lights were on over a particular period of time, like this:
or more importantly, work out why the bathroom never seems to be free when you’ve got two teenage kids in the house.


