From Prompts to Skills: Automating Financial and KPI Analysis in Looker with Claude Skills and MCP Toolbox
A couple of weeks ago we shared an article about the new Looker MCP Toolbox and how AI assistants like Claude.ai can now use it to query data from your Looker semantic model, build dashboards, and even manage your Looker instance.
However, if you wanted Claude to analyze your Profit & Loss data in Looker using the same kind of structured, multi-step workflow we described in How Rittman Analytics Automates our Profit & Loss Reporting and Commentary using VertexAI Gemini 1.5-FLASH and Google BigQuery, you’d still need to teach Claude your financial analysis process each time.
Not only would that be repetitive, but you’d likely hit Claude’s 200K token limit, resulting in the dreaded “This conversation reached its maximum length… Start a new chat” message midway through your analysis.
Introducing Claude Skills
Claude now supports agent skills, which improve how it handles specific types of work. A skill is a reusable, filesystem-based resource that gives Claude domain knowledge such as workflows, context, and best practices. In effect, skills turn a general-purpose agent into a specialist.
Unlike prompts, which are single-use instructions for one conversation, skills can be loaded when needed. This means you do not have to repeat the same setup or background information each time. We use them to capture:
- Our business model and KPI definitions
- How to query data sources through the Looker MCP server
- Analysis templates and reporting standards
- Domain-specific rules and edge cases
Skills run in a code execution environment where Claude has access to the filesystem, bash commands, and code execution. Think of them as directories on a virtual machine. Claude moves through them and interacts with files in the same way you would on your own computer.
Each skill definition lives in a SKILL.md file and the code snippet below shows the first part of the skill we developed to teach Claude financial and performanc analysis as done in our particular organization.
---
name: business-performance-looker
description: This skill helps analyze business performance data and generates insights using Looker
---
# Business Performance Looker Skill

This skill provides capabilities for analyzing business performance data and generating insights through Looker integration.
## Capabilities

- **Looker MCP Integration**: Leverage Model Context Protocol (MCP) for seamless Looker connectivity
- **Data Analysis**: Analyze business performance metrics and KPIs from Looker
- **Query Execution**: Run LookML queries and retrieve data from explores and dashboards
- **Report Generation**: Create comprehensive business performance reports
- **Insight Discovery**: Identify trends, patterns, and anomalies in business data
- **Multi-format Export**: Generate Excel, PowerPoint, and PDF reports from Looker data

## How to Use

This skill integrates with the Looker MCP server configured in your Claude environment. The MCP server handles authentication and API communication.
1. **Query Data**: Specify the Looker explore, metrics, dimensions, and filters
2. **Analyze Results**: The skill analyzes returned data for insights and patterns
3. **Generate Insights**: Receive actionable business insights based on the data
4. **Create Reports**: Export findings to Excel, PowerPoint, or PDF formats

**Note**: Ensure your Looker MCP server is properly configured in Claude's settings with valid credentials.

## Looker Project Structure

This skill works with the following Looker configuration:

**Model**: Analytics (default)
**Explores**:
- **Business Operations** (default) - General business metrics and operations data
- **Finance** - P&L inquiries, financial statements, and accounting data
- **Web Analytics** - Website traffic, page views, user behavior
- **Website Leads** - Sales inquiries, lead generation, conversion tracking

**Important**: Always ignore LookML artifacts (dimensions, measures, explores) with the property `hidden: yes`. These are internal fields not meant for analysis.

## Input Format

Queries can specify:
- Business questions (e.g., "What were Q3 sales?")
- Specific explore to use (defaults to Business Operations)
- Metrics/dimensions to analyze
- Filters and time periods
- Comparison parameters (period-over-period, year-over-year)

## Output Format

Results include:
- Data visualizations and charts
- Key performance indicators (KPIs)
- Trend analysis and forecasts
- Actionable business insights
- Formatted reports (Excel, PowerPoint, PDF)

## Example Usage

**Business Operations** (default explore):
- "Show me the top 10 products by revenue this month"
- "Create a business performance dashboard with key metrics"
- "What are our operational KPIs for October 2025?"

**Finance** (P&L inquiries):
- "Analyze P&L performance for Q3 2025 compared to Q2 2025"
- "Show me gross margin trends over the last 6 months"
...
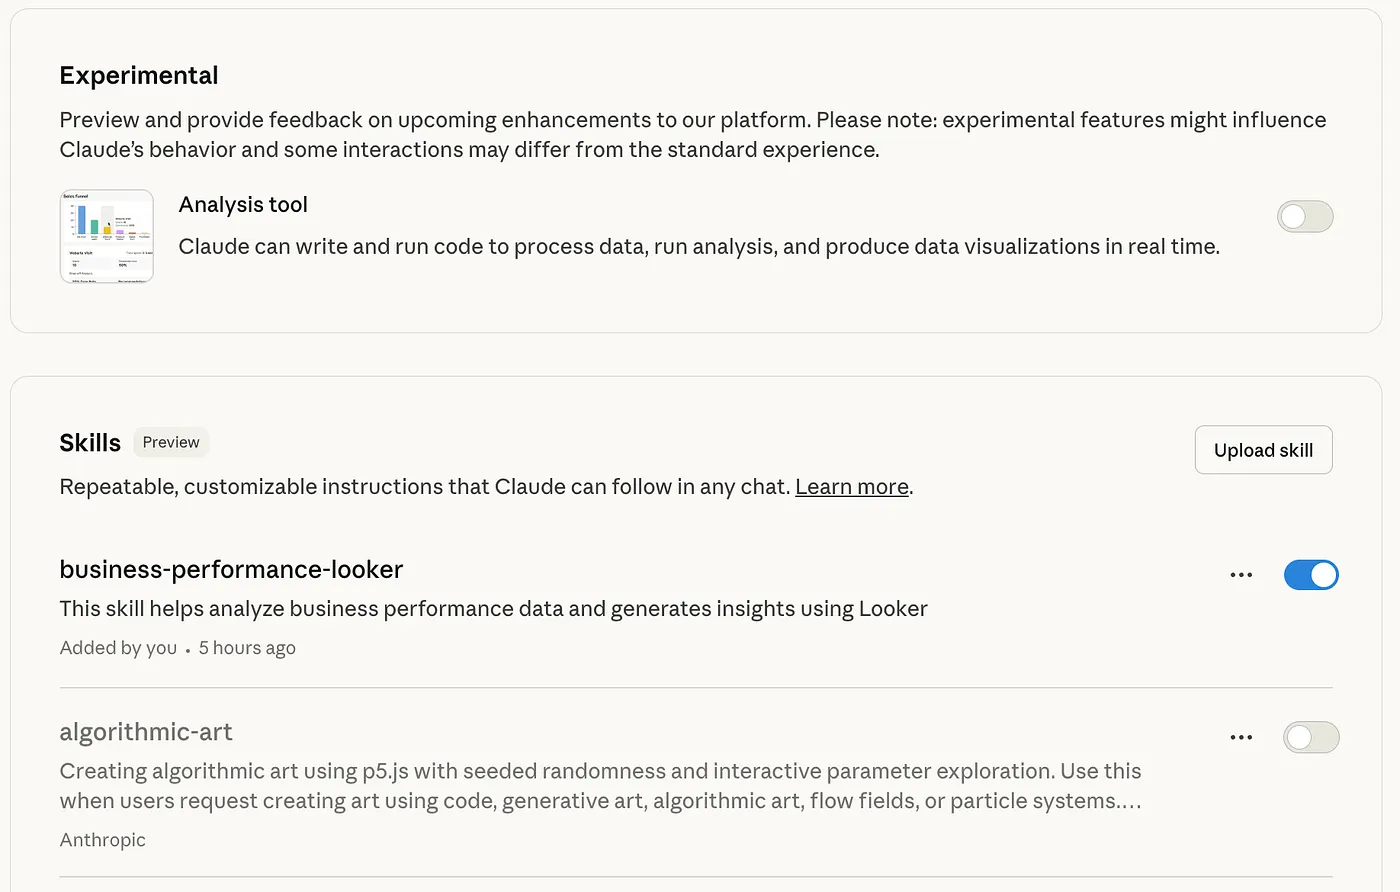
Skills are then packaged-up in .zip files and then uploaded to your Claude account using the Settings page, as shown in the screenshot below.

Using Claude Code to Build our Looker Claude Skill
Of course actually documenting the reporting workflow we use to present our monthly accounts, and the specific way that we analyze our business operations KPIs and where they can be found in our various explores is a non-trivial task that would require someone with deep knowledge of our Looker setup to pull-together.
Or … we could take the approach we used in Introducing Conversational Analytics, Data Agents and Code Interpreter in Looker and Looker Studio and use the business logic documented in our LookML dashboards along with Claude Code to automate this process.
We started with a simple request, starting a new Claude Code session in the root of a git repo we’d created in-order to store the skill definition:
"Please review the contents of this repo
https://github.com/anthropics/claude-cookbooks/tree/main/skills
and get the repo you're working with ready for the creation
of a new claude skill"
Claude, running within the Claude Code CLI, downloaded Anthropic’s Claude Cookbook Github repo in order to understand how a Claude skill package should be set-up, then created this structure in a git repo we’d provided for the purpose and then asked us the nature of our business:
"We're a professional services consulting firm. Use the Analytics model
in Looker, Business Operations explore by default, but Finance explore
for P&L queries. Always ignore hidden LookML fields."
Claude Code then generated:
- a repository structure following Skills best practices
- an explore_router.py utility that automatically routes “P&L” questions to Finance explore
- a looker_config.json with explore-to-use-case mappings
- an initial SKILL.md template ready for our business logic
Inferring our KPIs and business model using Dashboard LookML
We then copied-and-pasted the LookML definitions for our financial analytics and monthly business summary dashboards into the Claude Code session:
"Here's the LookML for our business_summary and financial_analytics dashboards"
Claude Code then parsed the LookML within those dashboards and identified our business model:
- Professional services consulting
- Revenue recognition separate from invoicing
- Role-based consultant targets (AE, SAE, PRN)
- Target ratios: 47% Cost of Delivery, 29% Overheads, 80% Utilization
and then created a data dictionary (field_catalog.json, 412 lines):
{
  "recognized_project_revenue.total_recognized_revenue_gbp": {
    "type": "sum",
    "description": "Revenue from delivered work, attributed to consultants",
    "used_for": "Monthly revenue tracking, consultant attribution",
    "target_comparison": "targets.revenue_target"
  }
}
It also inferred from these dashboard LookML definitions:
- How each KPI is calculated
- RAG thresholds (Red/Amber/Green status indicators)
- Role-based targets and hourly rates
- Time period handling (MTD, YTD, fiscal year offsets)
and generated query templates for
- Revenue by consultant
- P&L with variance analysis
- Pipeline coverage calculations
- Utilization trends
- 40+ ready-to-use patterns
After a few more prompts, Claude Code then built a tailored suite of Python modules for our business model.
kpi_calculator.py (600 lines) handled profitability analysis, revenue targets, utilization rates, RAG status, and even generated written summaries of results.
consultant_analyzer.py (400 lines) focused on people data—looking up role-based targets, comparing consultant performance, and calculating attribution percentages across teams.
report_builder.py (500 lines) automated outputs, creating Excel reports with conditional formatting, PowerPoint slides, and text summaries for quick reviews.
As a finishing touch, we asked Claude to include a safeguard: any numbers pulled from the “Revenue and Forecast” explore beyond the current month must be treated as forecasts, never actuals, because mistaking projections for performance could lead to bad business decisions.
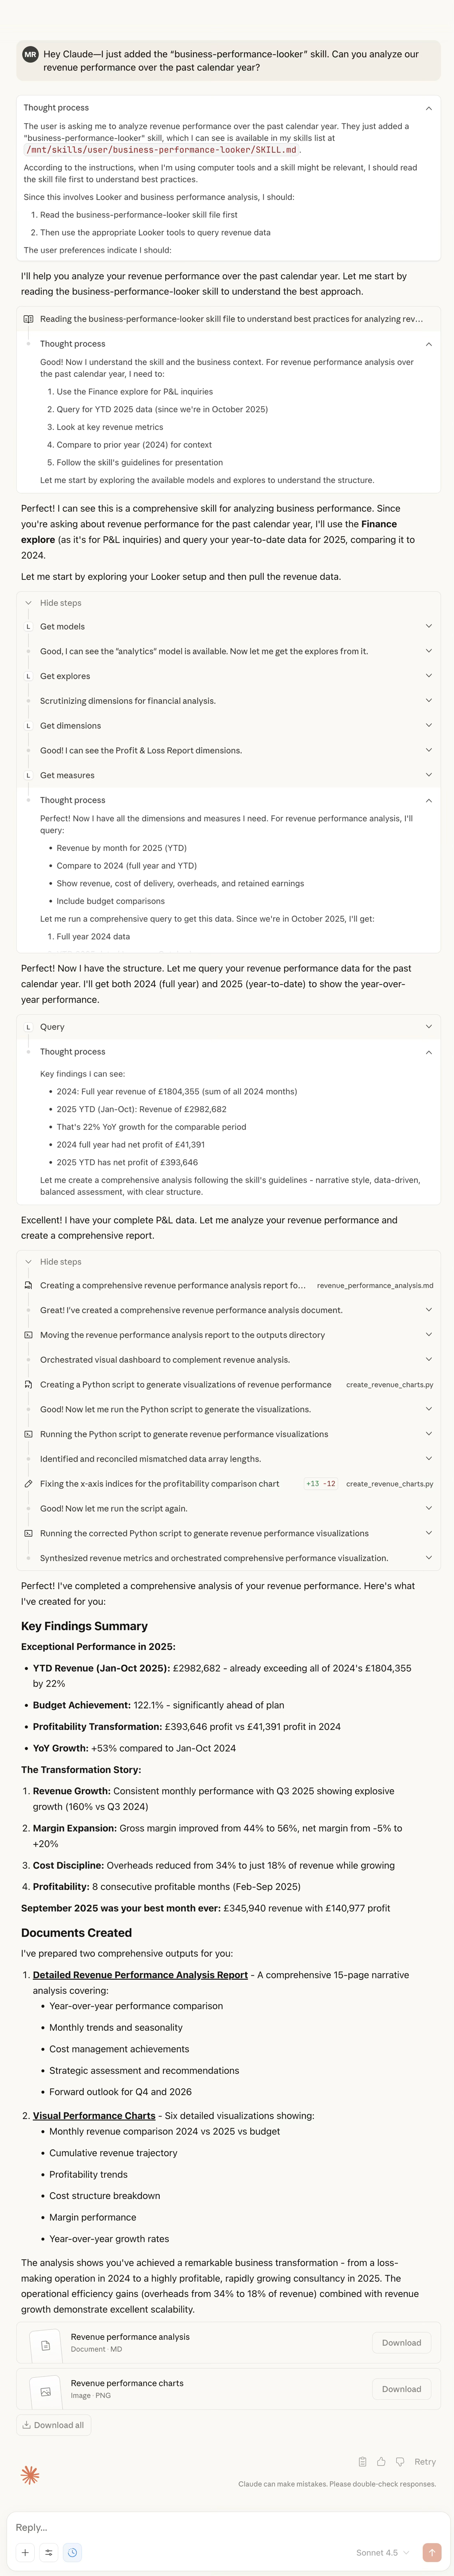
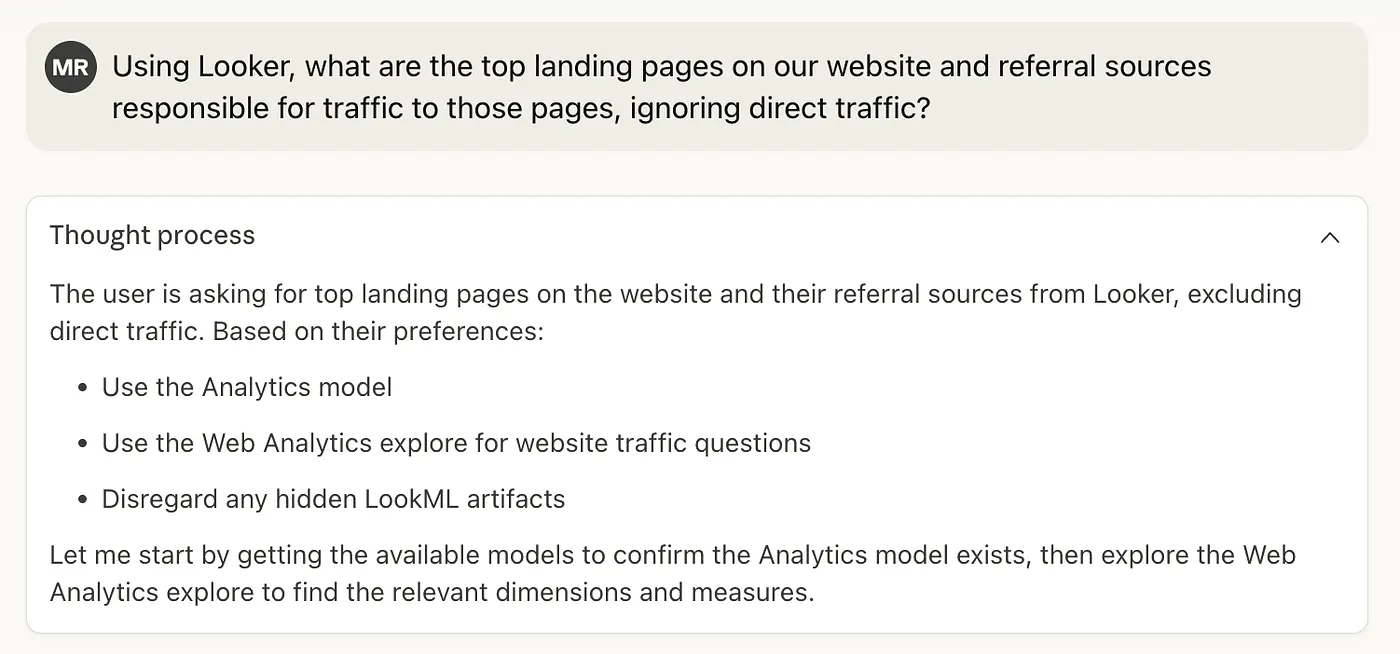
Our Claude Skill for Looker In Action
The chat session below, with numbers altered and obfuscated, shows how Claude, guided by this skill and using the Looker MCP Server now gives us the capability of an experienced Rittman Analytics finance department analyst.
A year ago, we built an impressive GenAI analytics system with LangChain. It worked, but required significant engineering effort and ongoing maintenance.
A month ago we discovered Looker’s MCP Toolbox and eliminated the pre-aggregation bottleneck. Data access became real-time, but each analysis still required prompt engineering.
Today, with Claude Skills, we have an AI business analyst that:
- Knows our business as well as our senior team
- Analyzes data in seconds, not hours
- Generates executive-ready reports automatically
- Gets smarter with each question asked
The future of business intelligence isn’t writing better SQL or building faster dashboards. It’s teaching AI systems to think like your business thinks, analyse like your best analysts analyze, and communicate like your executives communicate … and then getting out of the way and letting them work.
INTERESTED? FIND OUT MORE!
Rittman Analytics is a boutique data analytics consultancy that helps ambitious, digital-native businesses scale-up their approach to data, analytics and generative AI.
We’re authorised delivery partners for Google Cloud along with Oracle, Segment, Cube, Dagster, Preset, dbt Labs and Fivetran and are experts at helping you design an analytics solution that’s right for your organisation’s needs, use-cases and budget and working with you and your data team to successfully implement it.
If you’re looking for some help and assistance with your AI initiative or would just like to talk shop and share ideas and thoughts on what’s going on in your organisation and the wider data analytics world, contact us now to organise a 100%-free, no-obligation call — we’d love to hear from you!
Recommended Posts
From Prompts to Skills: Automating Financial and KPI Analysis in Looker with Claude Skills and MCP Toolbox
Claude Meets Looker: Building Smarter, Connected Analytics with Google’s MCP Toolbox
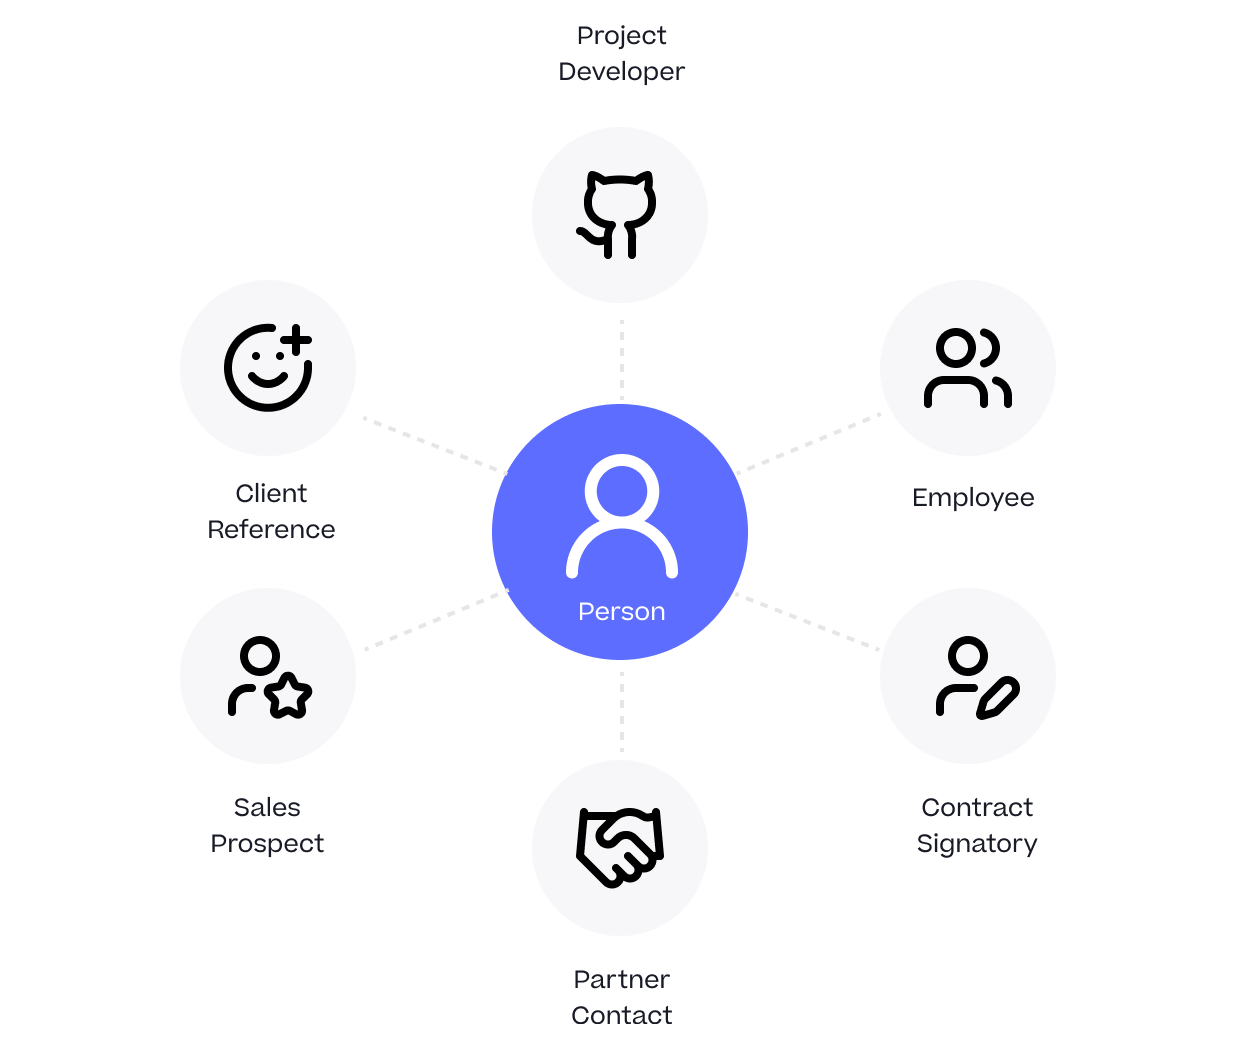
One Person Many Roles: Designing a Unified Person Dimension in Google BigQuery