Adventures in Aggregate Awareness (and Level-Specific Measures) with Looker
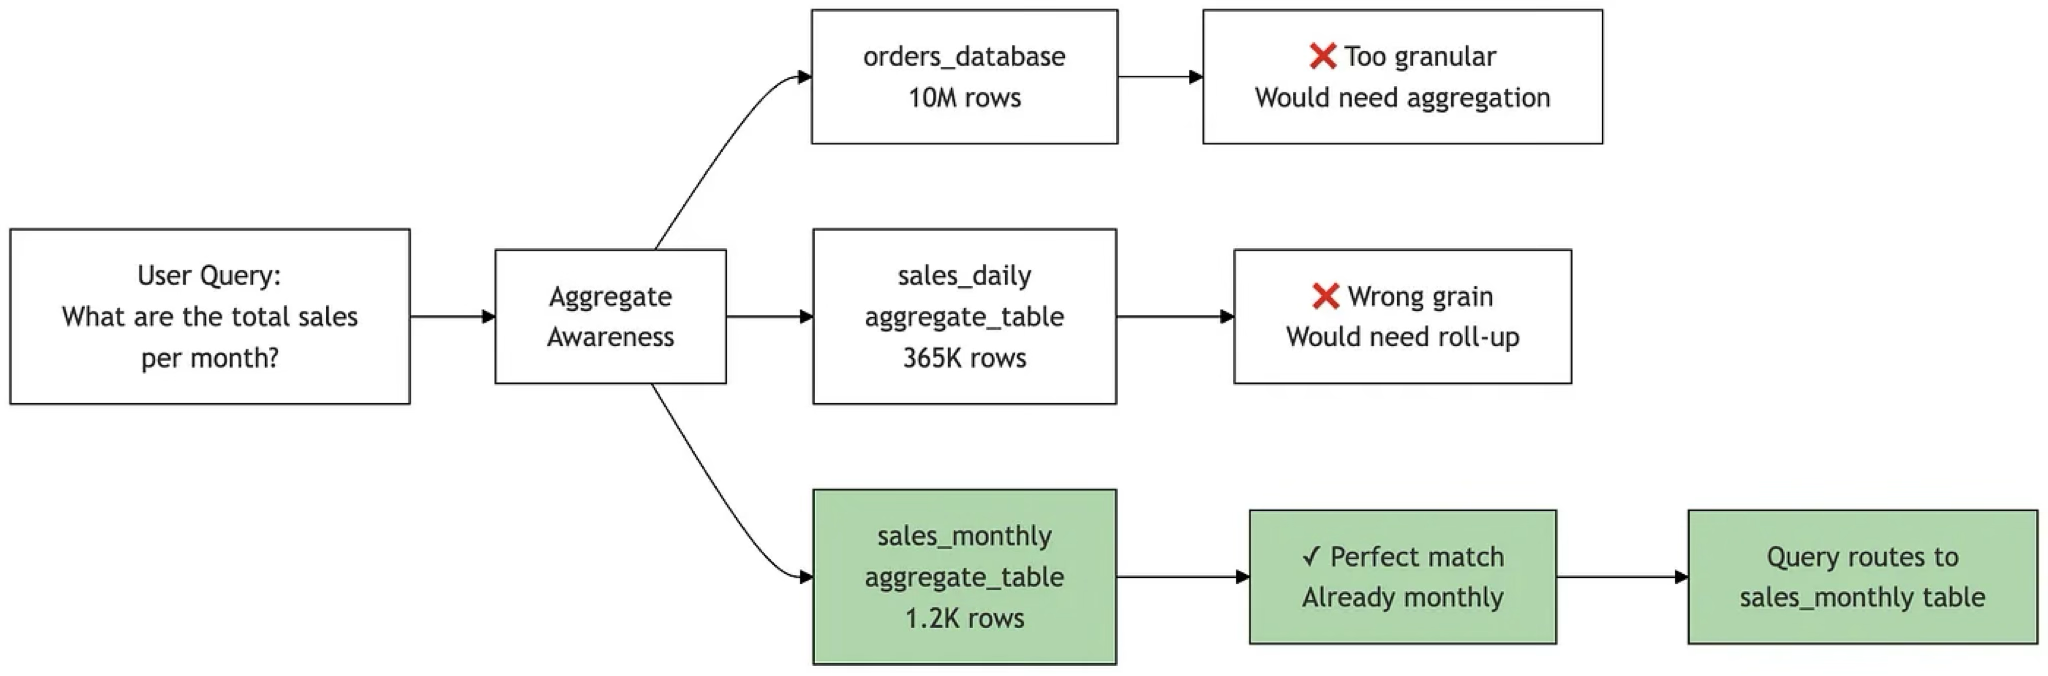
Looker aggregate awareness is a performance optimisation feature that automatically directs users’ queries to use pre-aggregated summary tables instead of detail-level transaction tables, significantly improving the performance of reports and dashboards that return aggregated data.
Once you have enabled aggregate awareness in your LookML model, Looker intelligently works-out when a query can be satisfied by a smaller, pre-computed aggregate table that contains the necessary dimensions and measures at the appropriate granularity, and then automatically rewrites the SQL so that it queries the summary table instead of the larger detail-level table.
This happens transparently to end users who continue to explore data normally while benefiting from faster query times, and the semantic layer you set-up tells Looker that daily roll-up can serve weekly/monthly/yearly queries, monthly can serve quarterly/yearly and so on.
Enabling Aggregate Awareness in Looker
Enabling this feature within your LookML model starts with defining aggregate tables within an explore using the aggregate_table parameter.
Each aggregate table specification includes a query definition with dimensions and measures, together with a materialization configuration that controls how the aggregate table is persisted.
In the LookML example below, this explore defines two aggregate tables on top of the orders explore to improve query performance:
- one rolls up sales at the daily store–category level with measures like revenue, order count, and average order value,
- while the other summarizes sales at the monthly category–customer segment level (restricted to completed orders) with measures including unique customers.
- Each aggregate table has its own refresh logic (
datagroup_triggerfor the daily table,sql_trigger_valuewith partitioning for the monthly table), and Looker will automatically use them when a query’s selected fields and filters match their definitions, falling back to the baseorderstable and its joins toproductsandstoreswhen needed.
  explore: orders {

  aggregate_table: daily_store_sales {
    materialization: { datagroup_trigger: daily_etl_datagroup }
    query: {
      dimensions: [orders.order_date, stores.store_id, products.category]
      measures:   [orders.total_revenue, orders.order_count, orders.average_order_value]
      timezone: America/Los_Angeles
    }
  }

  aggregate_table: monthly_category_sales {
    materialization: {
      sql_trigger_value: SELECT MAX(updated_at) FROM orders ;;
      partition_keys: ["order_month"]   # ensure this matches the aggregate column name
    }
    query: {
      dimensions: [orders.order_month, products.category, customers.customer_segment]
      measures:   [orders.total_revenue, orders.order_count, orders.unique_customers]
      filters:    [orders.status: "completed"]
    }
  }

  join: products { sql_on: ${orders.product_id} = ${products.id} ;; }
  join: stores   { sql_on: ${orders.store_id}  = ${stores.id}  ;; }
}
So how does Looker’s aggregate awareness feature work?
Aggregate Navigation Powered by Looker’s Semantic Model
Conceptually, Looker’s aggregate awareness works by maintaining a mapping between detailed base explores and their pre-aggregated counterparts through aggregate table definitions in your LookML model.
When a user runs a query, Looker’s query engine examines the requested dimensions and measures, then checks if there’s a matching aggregate table that contains all the required fields at an appropriate granularity. If found, it automatically rewrites the generated SQL to query the smaller aggregate table instead of the base table.
The system tracks which dimensions can be “rolled up” (like date to month, or product to category) and which measures are additive, allowing it to determine when an aggregate table is a valid substitute for querying the base-level table.
Behind the scenes, Looker maintains aggregate tables as persistent derived tables (PDTs) for which it takes responsibility for refreshing as specified by their materialisation settings. It then acts as an “intelligent router” that transparently redirects queries to the optimal table based on the query pattern, without the end user needing to know multiple aggregations of the base-level table exist or manually choose between detailed and summary versions.
Incrementally-Refreshing your Aggregates
As is the case with PDTs, you should generally try to refresh your aggregate awareness tables incrementally (rather than as full rebuilds) to incorporate new and changed data as it arrives in the base-level transaction table.
Incremental refresh for aggregate tables in Looker works by rebuilding only recent time periods of an aggregate table rather than recreating the entire table from scratch. When you define an increment_key (a date/time dimension) and an increment_offset (number of periods to rebuild), Looker automatically deletes data for those recent periods from the existing aggregate table and rebuilds just those periods from the source data during each refresh, such as in the LookML example below.
# Daily aggregate with incremental refresh
    aggregate_table: daily_store_sales {
      query: {
        dimensions: [order_date, stores.store_id, products.category]
        measures: [total_revenue, order_count, average_order_value]
        timezone: "America/Los_Angeles"
      }
      materialization: {
        datagroup_trigger: daily_etl_datagroup
        increment_key: "order_date"
        increment_offset: 3  # Rebuild last 3 days for late-arriving data
      }
    }
In addition, when an aggregate table is built with a time filter Looker can UNION fresh data to the aggregate table to keep results up to date. For example, suppose you maintain an aggregate table covering the last three days, but it was last rebuilt yesterday; on its own, that table wouldn’t include today’s records so you wouldn’t normally expect it to serve a query asking for the most recent daily data.
In this case, Looker compensates by querying today’s data directly and then unioning those fresh results with the aggregate table. This behaviour applies when the aggregate table:
- has a time filter defined, and
- includes a dimension derived from the same time field as that filter.
Looker-Managed vs. Database-Managed Aggregates
Of course data warehousing platforms such as Google BigQuery and Snowflake data warehouse have their own, in-built aggregate management capabilities which typically have more features and cover a wider range of queries and aggregation functions than just the SUM, COUNT, AVERAGE, MIN, and MAX that Looker permits.
As a rule-of-thumb, you should choose Looker’s aggregate awareness feature when you need to use business logic in the aggregate definition that only exists in your LookML model, or when your team lacks lacks database admin privileges but has Looker development access; either way the resulting aggregate tables still go in your data warehouse but it’s Looker creating them, not you using SQL scripts or your database admin console.
In most other cases when you can have your warehouse define and maintain those aggregates and take-care of query redirection for you in the background, this generally is more efficient solution with a wider set of use-cases it can cover and it keeps this complexity out of your Looker model, just as using dbt or Dataform for data transforming makes more sense than trying to do all of this via LookML.
If this is as complex as your aggregate awareness needs are likely to get, you can stop reading now and everthing’s covered. If however you’re one of those complicated enterprise customers, typically in the retail vertical where you’re migrating all of this from Oracle and some legacy old BI tool along with an ETL process that already creates and manages your summary tables, go and get yourself a stiff drink and read on.
The Challenge in Using Externally-Created Aggregate Tables
There are, of course, situations where you want to create and manage your aggregate tables external to Looker, but you still want Looker to make use of those tables when running dashboards and reports that require aggregated data in their results.
For example, a client we helped implement Looker for recently had already invested a substantial amount of time creating ETL routines to build and manage their BigQuery summary tables and expected to be able to configure Looker’s aggregate awareness to use those, rather then build them all again itself.
Unfortunately however, their assumption was incorrect as Looker’s aggregate awareness can only use aggregate tables that it actually creates and manages. Why? Because Looker needs specific metadata to make aggregate awareness (specifically, query rewriting) work and it can’t get that information from database objects that you’ve created independently of Looker.
Manually Configuring Aggregate Awareness using Liquid and _in_query
If for whatever reason recreating your aggregate table logic and refresh routines in Looker using aggregate awareness just isn’t practical, then there is a hybrid approach that was used before this feature became available in Looker that you can use, with caveat that it’s more complex and fragile to implement than just using built-in aggregate awareness.
This hybrid approach leverages the Liquid templating language you can embed in your LookML model along with the _in_query variable that tells you whether certain fields such as a daily, monthly, or yearly timeframe field are present in the query. Hang on to your hats though as it gets complex, quickly.
In the example code below we’ve creates a single “router” LookML view with a derived_table that picks the right physical table via Liquid, along with measures that switch between summing pre-aggregated values vs. computing using aggregations of your detail-level data.
view: orders_base {
  sql_table_name: schema.orders ;;
}

view: daily_store_sales {
  sql_table_name: schema.daily_store_sales ;; # (order_date, store_id, category, total_revenue, order_count, average_order_value, …)
}
view: monthly_category_sales {
  sql_table_name: schema.monthly_category_sales ;; # (order_month, category, customer_segment, total_revenue, order_count, unique_customers, …)
}
# 2) Routing view that standardizes the schema and chooses the source with Liquid
view: orders_router {
  derived_table: {
    # IMPORTANT: align/alias columns so the same field names exist no matter which table we pick.
    # Add/remove columns to match your schema.
    sql:
      SELECT
        -- time
        CAST(order_date AS DATE)            AS order_date,
        CAST(order_month AS DATE)           AS order_month,
        -- dims
        store_id,
        category,
        customer_segment,
        status,
        product_id,
        -- pre-agg measures (present in agg tables; null in base when not applicable)
        total_revenue,
        order_count,
        average_order_value,
        unique_customers,
        -- raw columns (present in base; null in aggs)
        revenue,
        user_id
      FROM
      {% if orders_router.order_date._in_query
            or stores.store_id._in_query
            or products.category._in_query %}
        ${daily_store_sales.SQL_TABLE_NAME}
      {% elsif orders_router.order_month._in_query
            or customers.customer_segment._in_query %}
        ${monthly_category_sales.SQL_TABLE_NAME}
      {% else %}
        ${orders_base.SQL_TABLE_NAME}
      {% endif %} ;;
  }
  # ------- Dimensions (shared names across all sources) -------
  dimension_group: order_date {
    type: time
    timeframes: [date, week, month, year]
    sql: ${TABLE}.order_date ;;
  }
  # Optional explicit month dim if you use it directly in Explores
  dimension: order_month { type: date sql: ${TABLE}.order_month ;; }
  dimension: store_id { sql: ${TABLE}.store_id ;; }
  dimension: category { sql: ${TABLE}.category ;; }
  dimension: customer_segment { sql: ${TABLE}.customer_segment ;; }
  dimension: status { sql: ${TABLE}.status ;; }
  dimension: product_id { sql: ${TABLE}.product_id ;; }
  dimension: user_id { hidden: yes sql: ${TABLE}.user_id ;; } # only populated when base table is used
  # ------- Measures with Liquid fallbacks -------
  measure: total_revenue {
    type: number
    sql:
      {% if orders_router.order_date._in_query
            or stores.store_id._in_query
            or products.category._in_query
            or orders_router.order_month._in_query
            or customers.customer_segment._in_query %}
        -- On aggregate tables, sum the pre-aggregated value
        SUM(${TABLE}.total_revenue)
      {% else %}
        -- On base table, compute from raw
        SUM(${TABLE}.revenue)
      {% endif %} ;;
  }
  measure: order_count {
    type: number
    sql:
      {% if orders_router.order_date._in_query
            or stores.store_id._in_query
            or products.category._in_query
            or orders_router.order_month._in_query
            or customers.customer_segment._in_query %}
        SUM(${TABLE}.order_count)
      {% else %}
        COUNT(*)  -- or COUNT_DISTINCT order_id if appropriate
      {% endif %} ;;
  }
  measure: average_order_value {
    type: number
    value_format: "£#,##0.00"
    sql:
      {% if orders_router.order_date._in_query
            or stores.store_id._in_query
            or products.category._in_query %}
        -- Prefer pre-aggregated AOV if provided
        AVG(${TABLE}.average_order_value)
      {% elsif orders_router.order_month._in_query
            or customers.customer_segment._in_query %}
        AVG(${TABLE}.average_order_value)
      {% else %}
        NULLIF(SUM(${TABLE}.revenue),0) / NULLIF(COUNT(*),0)
      {% endif %} ;;
  }
  measure: unique_customers {
    type: number
    sql:
      {% if orders_router.order_month._in_query
            or customers.customer_segment._in_query %}
        SUM(${TABLE}.unique_customers)
      {% else %}
        COUNT_DISTINCT(${TABLE}.user_id)
      {% endif %} ;;
  }
}
# 3) Explore uses the router as its FROM and keeps your joins the same
explore: orders {
  from: orders_router
  join: products {
    relationship: many_to_one
    sql_on: ${orders_router.product_id} = ${products.id} ;;
  }
  join: stores {
    relationship: many_to_one
    sql_on: ${orders_router.store_id} = ${stores.id} ;;
  }
  join: customers {
    relationship: many_to_one
    sql_on: ${orders_router.user_id} = ${customers.id} ;;
    # Note: user_id only exists when falling back to base; for agg tables, unique_customers is pre-agg.
  }
}
- If a user selects daily fields or store/category detail, the router LookML view pulls from
daily_store_saleswhereas if they pivot byorder_monthor slice bycustomer_segment, it pulls frommonthly_category_sales, otherwise it falls back toorders_base - Measures switch between summing pre-aggregated columns (on aggs) and calculating from raw (on base), so users keep one explore and get the fastest table automatically.
Level-Specific Measures and Aggregate Awareness
If it were just the effort involved in recreating their existing aggregate management logic in LookML aggregate tables, I’d advise the client to just suck it up and rebuild it in Looker if they wanted the certainty of managing aggregate management and navigation in Looker
But more significantly they also needed all of this to support a number of measures that existed only at specific aggregation levels, for example, promotional discounts tracked at category level and shrinkage recorded at department level, as shown in the diagram below.
The problem with level-specific measures such as the promotional data and inventory-shrinkage data in this example, is that Looker’s aggregate awareness feature:
- requires all measures to exist in every aggregate table (or be computable from existing columns)
- can’t handle measures that are NULL at certain aggregation levels
- would fail when trying to route queries for measures that don’t exist in certain tables
To solve this problem we helped them implement an extension of the hybrid aggregate awareness solution that:
- Only queries tables that actually contain the requested measures
- Explicitly returns NULL rather than incorrect values when measures are incompatible with the requested grain
- Maintains a single explore interface while transparently handling the complexity
view: sales_router {
  derived_table: {
    sql:
      SELECT
        -- Keys at both grains (NULL where not applicable)
        department_id,
        category_id,
        -- Measures at their native grains
        promo_discount,   -- only populated by category-level PDT
        shrinkage,        -- only populated by department-level PDT
        revenue, order_id, user_id
      FROM
      {% if sales_router.promo_discount._in_query or products.category._in_query %}
        ${category_agg.SQL_TABLE_NAME}     -- category grain PDT (has promo_discount)
      {% elsif sales_router.shrinkage._in_query or products.department._in_query %}
        ${department_agg.SQL_TABLE_NAME}   -- department grain PDT (has shrinkage)
      {% else %}
        ${orders_base.SQL_TABLE_NAME}      -- raw fallback
      {% endif %} ;;
  }

  dimension: department_id { sql: ${TABLE}.department_id ;; }
  dimension: category_id   { sql: ${TABLE}.category_id ;; }

  # Category-grain measure
  measure: promo_discount {
    type: number
    sql:
      {% if products.category._in_query or sales_router.promo_discount._in_query %}
        SUM(${TABLE}.promo_discount)
      {% elsif products.department._in_query or sales_router.shrinkage._in_query %}
        NULL  -- incompatible grain: category measure asked for at department grain
      {% else %}
        -- If neither grain is explicitly asked, allow safe roll-up from category PDT
        SUM(${TABLE}.promo_discount)
      {% endif %} ;;
  }

  # Department-grain measure
  measure: shrinkage {
    type: number
    sql:
      {% if products.department._in_query or sales_router.shrinkage._in_query %}
        SUM(${TABLE}.shrinkage)
      {% elsif products.category._in_query or sales_router.promo_discount._in_query %}
        NULL  -- incompatible grain: department measure at category grain
      {% else %}
        -- If grain not explicit, safe roll-up from department PDT
        SUM(${TABLE}.shrinkage)
      {% endif %} ;;
  }

  # Generic measures that work at any grain (compute from base when needed)
  measure: total_revenue {
    type: number
    sql:
      {% if products.category._in_query or sales_router.promo_discount._in_query %}
        SUM(${TABLE}.revenue)           -- category PDT has revenue at category grain
      {% elsif products.department._in_query or sales_router.shrinkage._in_query %}
        SUM(${TABLE}.revenue)           -- department PDT has revenue at department grain
      {% else %}
        SUM(${TABLE}.revenue)           -- base fallback
      {% endif %} ;;
  }
}
This manual aggregate awareness routing system solves the level-specific measure problem through two key mechanisms:
1. Dynamic Table Selection : The derived table uses Liquid templating to choose the appropriate source table based on what’s in the query:
- If
promo_discountorcategoryis requested → routes tocategory_aggtable - If
shrinkageordepartmentis requested → routes todepartment_aggtable - Otherwise → falls back to
orders_basetable
2. Measure-Level NULL Handling : Each measure contains logic to return NULL when requested at an incompatible grain:
For promo_discount (only exists at category level):
- Returns
SUM(promo_discount)when category grain is requested - Returns
NULLwhen department grain is requested (preventing incorrect aggregation)
For shrinkage (only exists at department level):
- Returns
SUM(shrinkage)when department grain is requested - Returns
NULLwhen category grain is requested
The trade-off again though is maintenance complexity as you’ll need to manually update the routing conditions whenever measure availability changes, whereas native aggregate awareness would handle standard measures automatically (though it still wouldn’t handle level-specific measures at all, hence this more complex and manual approach.
Interested? Find out more!
Rittman Analytics is a boutique data analytics consultancy that helps ambitious, digital-native businesses scale-up their approach to data, analytics and generative AI.
We’re authorised delivery partners for Google Cloud along with Oracle, Segment, Cube, Dagster, Preset, dbt Labs and Fivetran and are experts at helping you design an analytics solution that’s right for your organisation’s needs, use-cases and budget and working with you and your data team to successfully implement it.
If you’re looking for some help and assistance with your BI or data warehousing initiative or would just like to talk shop and share ideas and thoughts on what’s going on in the wider data world, contact us now to organise a 100%-free, no-obligation call — we’d love to hear from you!
Recommended Posts
Adventures in Aggregate Awareness (and Level-Specific Measures) with Looker
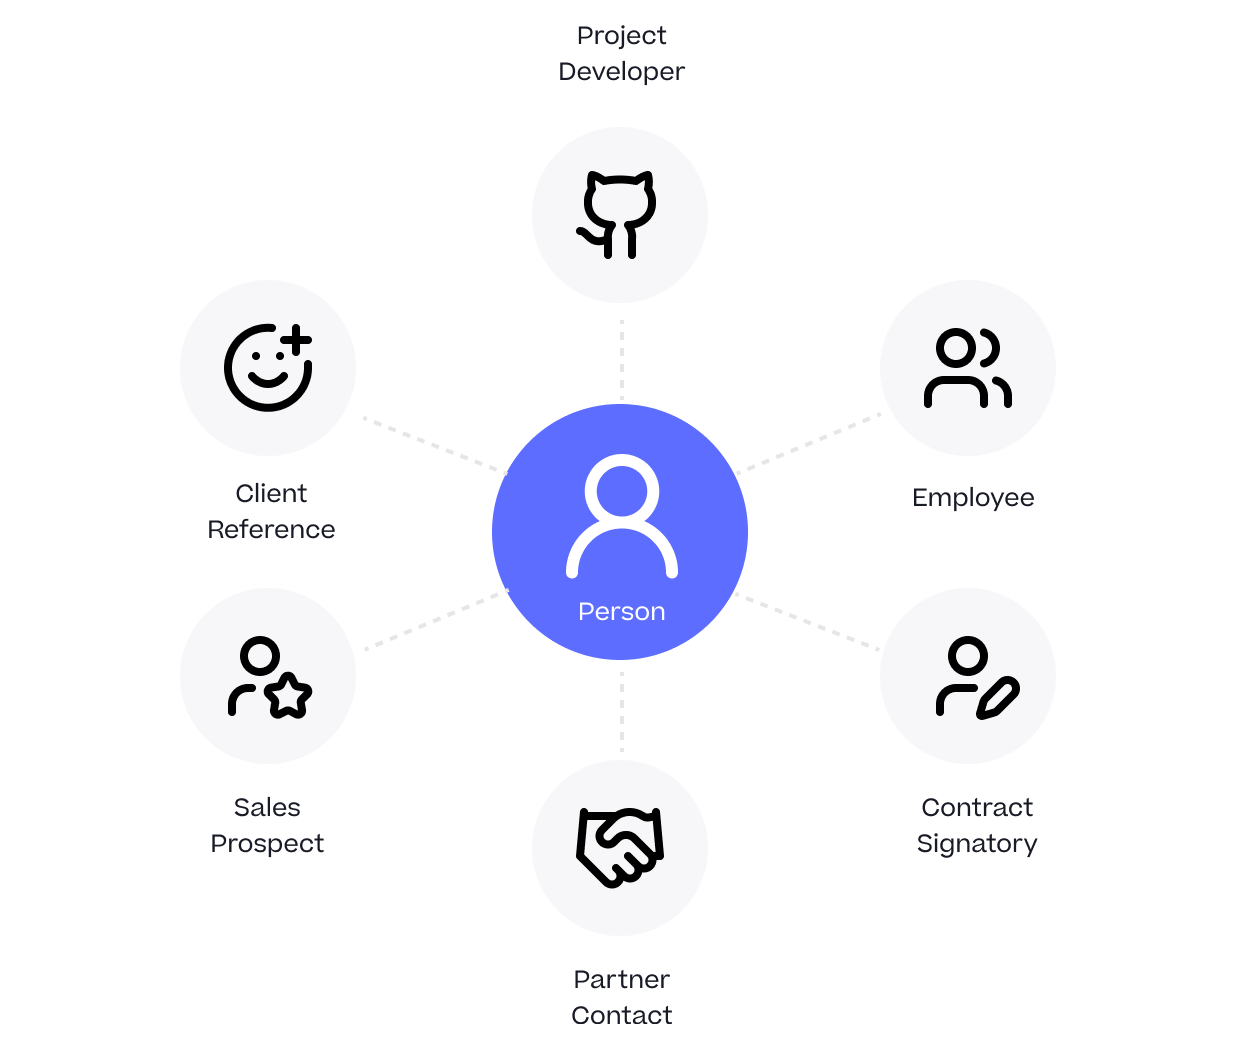
One Person Many Roles: Designing a Unified Person Dimension in Google BigQuery
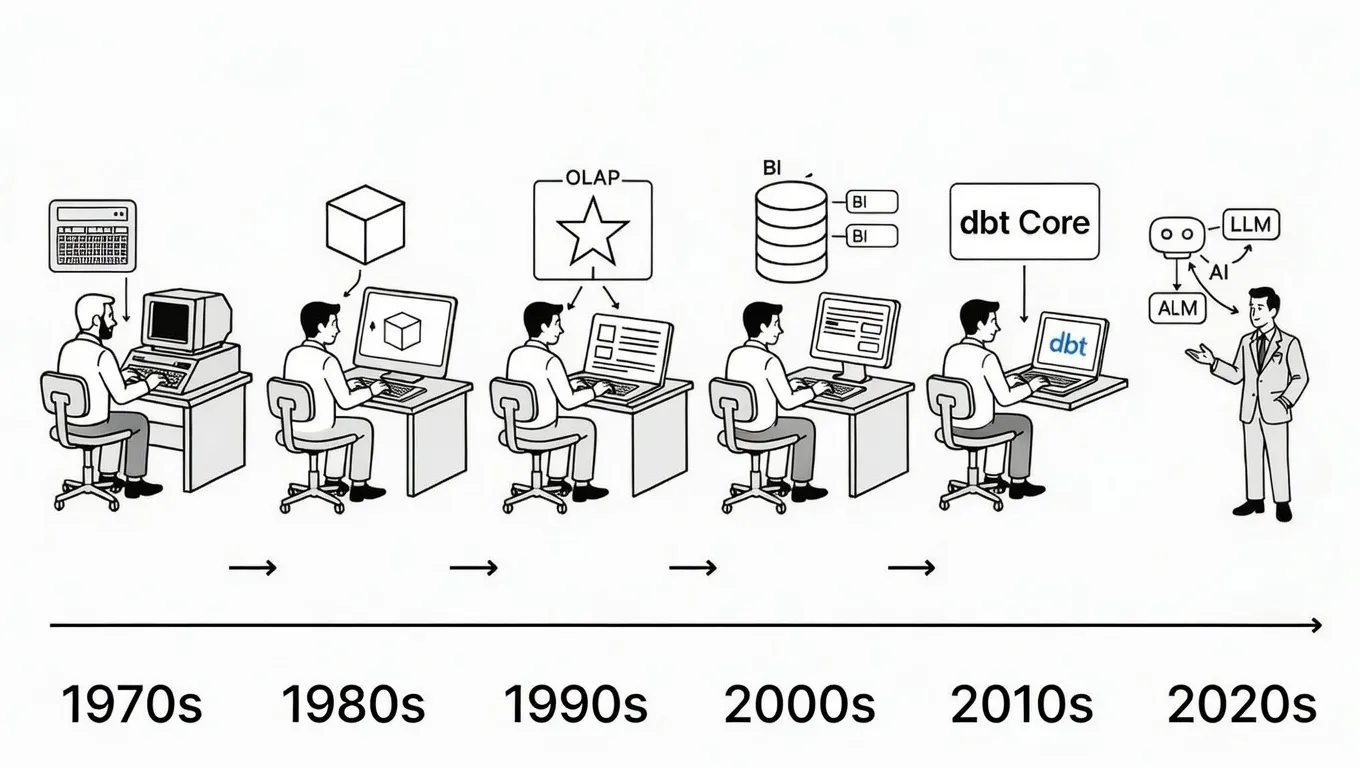
Why We’ve Tried to Replace Data Analytics Developers Every Decade Since 1974