How Rittman Analytics Automates our Profit & Loss Reporting and Commentary using VertexAI Gemini 1.5-FLASH and Google BigQuery
A Profit & Loss Report (or “Income Statement” in some countries) is a financial report, typically produced monthly, quarterly or annually, that sets out the income, direct and overheads costs and the final net profit for a business.
If, like us, you use Xero to run your company accounts then your typical default Profit & Loss report looks like the one below, based on the Demo Company data available in Xero.

It’s great to see your sales, gross profit, operating profit and what’s left after taxation on one page but as I said in our previous blog on Automating Insights and Dashboard Report-Level Narratives, producing the report is just the first stage in a data-driven organization; you have to then understand what the report is telling you and then work-out what actions need to be taken with this new information.
In the case of a Profit & Loss report such as this one, I’d want to understand the answer to questions such as:
-
How does this month’s revenue, gross margin (the percentage of revenue left after direct costs are deducted) and net margin (the same but after overheads are deducted) compare to last month? And for quarter-to-date how do these compare against the last quarter-to-date? Year-to-date? And so on
-
For account categories such as Administrative Costs (aka “overheads”) which account groups are trending-up over the past few months, something I’d want to keep a handle on if elements of our back-office costs keep rising month-on-month
-
Similarly, if spend on a category or account group has risen suddenly this month, or if sales have jumped unexpectedly, what individual transactions were the root-cause of these changes?
-
If I have my budget figures also stored in Xero, how does this months, quarter’s and year-to-date numbers compare to plan and are we on-track to hit our overall targets?
And then, once I have this information, what does then mean for our management plans for the coming months? Do we need to look at our costs and bring them back in-line with our original plan for the year? Are sales an issue and do we need to work on building our pipeline?
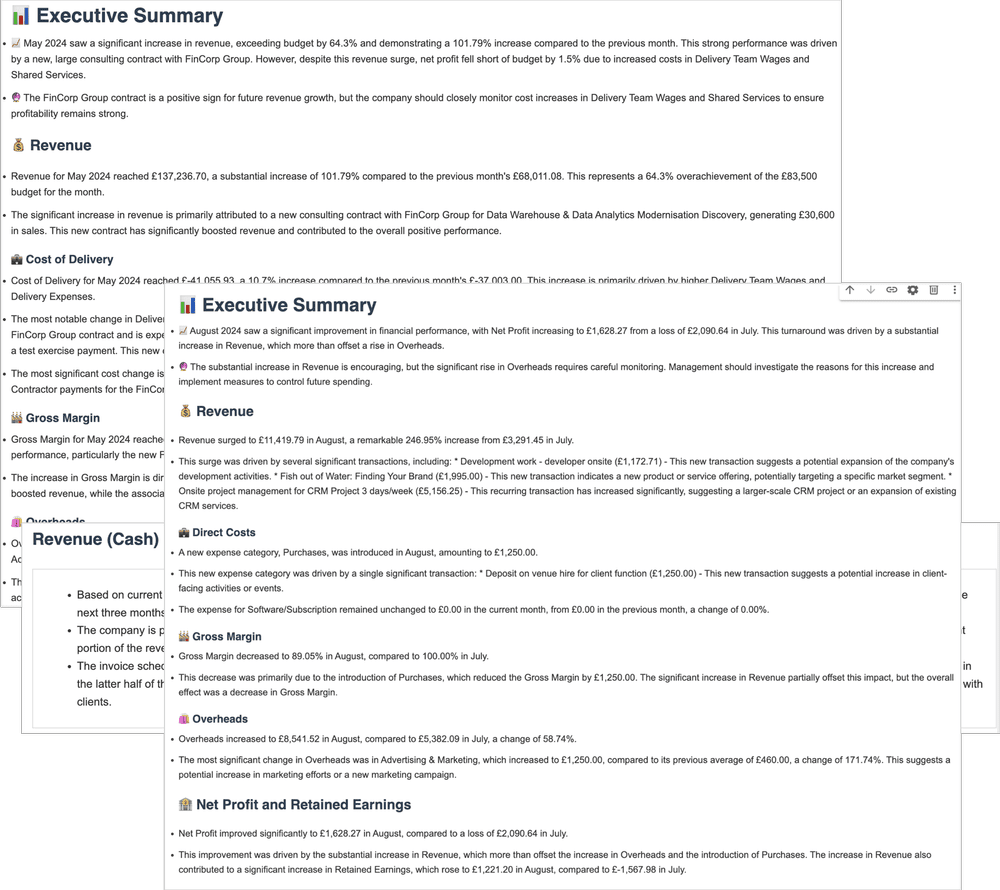
In this blog we’ll look at how generative AI, in the form of Vertex AI’s Gemini 1.5-FLASH LLM, can be used to automate the analysis of this multi-level financial dataset to produce insightful and actionable report commentary such as the examples shown below.
In our previous article on using gen AI to automate the production of report narratives we used a relative simple example where we asked an LLM to analyze a table of monthly KPI values and asked it to comment on this month’s performance compared to last months’ and quarter-to-date, and gave it some basic guidance on how profit was made-up of revenue minus costs and so forth.
In the case of analyzing a profit and loss report though you need to be more structured in how you perform your calculations and approach the process of analyzing the result of those calculations and investigating root cause.
Mirroring the thought process outlined earlier where we start at account category level and calculate all the period-on-period variances, then go down to account group level and finally identify the individual transactions that led to those variances and anomalies, we created a data pipeline that starts with the dbt transformations that Fivetran can run when replicating your Xero data into your data warehouse and created a BigQuery Python notebook that performed those same analysis steps, which we’ve made available to download along with a readme file from our Github account.
Looking at the output from this stage of processing in that BigQuery notebook shows you enhanced P&L report dataset that we’ll pass to Vertex AI the following step to get our report commentary.
The notebook then performs all of the trend analysis, root-cause identification and other complex financial calculations that need to be done in a specific, controlled and repeatable way using Python Pandas dataframe calculations, like this example that identifies significant transactions contributing to a variance in month-on-month account-level spend:
def get_significant_transactions(transactions_data, account_group, date, threshold=0.1, months_to_check=6):
  current_month = transactions_data[(transactions_data['account_report_group'] == account_group) &
                   (transactions_data['date_month'] == date)]
  previous_months = transactions_data[(transactions_data['account_report_group'] == account_group) &
                    (transactions_data['date_month'] > date - pd.DateOffset(months=months_to_check)) &
                    (transactions_data['date_month'] < date)]

  total_amount = current_month['journal_net_amount'].sum()
  significant_transactions = current_month[abs(current_month['journal_net_amount']) > abs(total_amount * threshold)]

  # Identify and remove cancelling transactions
  trans_list = significant_transactions.to_dict('records')
  cancelling_pairs = identify_cancelling_transactions(trans_list)
  indices_to_remove = set([i for pair in cancelling_pairs for i in pair])
  filtered_transactions = [trans for i, trans in enumerate(trans_list) if i not in indices_to_remove]

  # Add context for each transaction
  for transaction in filtered_transactions:
    similar_transactions = previous_months[
      (previous_months['account_name'] == transaction['account_name']) &
      (previous_months['description'].str.contains(transaction['description'].split('-')[0], regex=False, na=False))
    ]

    if not similar_transactions.empty:
      transaction['is_recurring'] = True
      transaction['previous_occurrences'] = len(similar_transactions)
      transaction['average_previous_amount'] = similar_transactions['journal_net_amount'].mean()
      transaction['change'] = transaction['journal_net_amount'] - transaction['average_previous_amount']
      transaction['is_new'] = False
    else:
      transaction['is_recurring'] = False
      transaction['previous_occurrences'] = 0
      transaction['average_previous_amount'] = 0
      transaction['change'] = transaction['journal_net_amount']
      transaction['is_new'] = True

    # Categorize the transaction
    transaction['category'] = categorize_transaction(transaction['description'], transaction['account_name'])

  return filtered_transactions
The way that we then structured the prompt that was then sent to the Gemini 1.5-FLASH model was key to the quality of the report analysis and commentary:
Analyze the following Profit and Loss data for {month} and provide a management report:

  {financial_data}

  Account Group Details (including significant transactions):
  {account_group_details}

  Cost Change Analysis:
  {cost_change_analysis}

  Do not use markdown formatting, * or #. All financial amounts are in GBP (£)

  **Focus on:**

  1. Analyze Revenue, Cost of Delivery, and Overheads, highlighting significant account groups and transactions that have influenced these categories.
  2. Pay special attention to the significant transactions listed for each account group. Explain how these transactions have impacted the overall performance of their respective categories.
  3. Explain how changes in these transactional categories, including the effect of significant transactions, have impacted Gross Margin, Net Profit, and Retained Earnings.
  4. Compare against previous month actual, calling out significant increases/decreases in the numbers, and relate these to any anomalous transactions where relevant.
  5. Analyze YTD vs. LYTD performance, highlighting areas of over- and under-performance, considering the impact of significant transactions on these trends.
  6. Ignore any double-entry but cancelling transactions, such as a negative expense followed by a positive expense of the same amount. These are typically corrections of administrative errors and should not be considered in the analysis.
  7. When analyzing cost changes, focus on the actual causes of increases or decreases as shown in the Cost Change Analysis. Do not attribute changes to new hires or costs unless explicitly stated in the analysis.
  8. Ensure all financial calculations are consistent. When discussing costs, always treat them as positive values for calculation purposes, even if they are recorded as negative values in the accounting system.
  9. When describing changes in costs or revenues, ensure that the direction of change (increase/decrease) matches the sign of the percentage change. For example, if a cost decreased, the percentage change should be described as a decrease (negative percentage), not an increase.
  10. Do not speculate about the reason any changes or transactions you see, and never state any person (e.g. staff) names when discussing salaries, bonuses or dividends:

  When analyzing significant transactions, provide context for each transaction:
  1. Indicate whether it's a new transaction that wasn't present in the previous months.
  2. If it's not new, specify how much it has changed compared to its average in previous months.
  3. Explain the potential reasons for new transactions or significant changes in existing ones.
  4. For recurring transactions, avoid describing them as "new" and instead focus on any changes in their amounts.

  When discussing changes in categories or specific expenses:
  1. Always include the current amount, previous amount, and the percentage change.
  2. For new expenses or categories, clearly state that they are new and provide their amounts.
  3. Use the following format for discussing changes:
   "[Category] [increased/decreased] to [current amount] in [current month], compared to [previous amount] in [previous month], a change of [percentage]%."
  4. When mentioning new expenses, use the format:
   "A new expense for [category] was introduced, amounting to [amount]."
  5. For recurring expenses that have changed, use the format:
   "The expense for [category] [increased/decreased] to [current amount], compared to its previous average of [average amount], a change of [percentage]%."

  ** Output your analysis in a concise and informative manner, suitable for senior management and executives. Format your response using the following HTML structure:**
  ** Use the Economist Style Guide as your writing style, with bold tags on important elements such as account group names and anomalous transaction details. Do not use markdown formatting or "**" in your responses.

  <h1>📊 Executive Summary</h1>
  <ul>
   <li>📈 [Key summary point about overall financial performance in the context of change vs. last month]</li>
   <li>🔮 [Key summary point about future outlook or recommendations, considering observed anomalies]</li>
  </ul>

  <h2>💰 Revenue</h2>
  <ul>
   <li>[Key point about revenue]</li>
   <li>[Explanation of significant variations in revenue account groups, including impact of notable transactions]</li>
  </ul>

  <h3>💼 Direct Costs</h3>
  <ul>
   <li>[Key point about direct costs]</li>
   <li>[Explanation of the top one or two significant variations in direct costs account groups, including impact of the one most notable transaction in each delivery group. For each significant transaction, specify whether it's new or how it has changed from its average in previous months.]</li>
   <li>[Analysis of the one most significant cost change, focusing on the actual causes of increases or decreases as shown in the Cost Change Analysis]</li>
  </ul>

  <h3>🏭 Gross Margin</h3>
  <ul>
   <li>[Key point about gross margin]</li>
   <li>[Explanation of how changes in Revenue and Cost of Delivery, including significant transactions, have impacted Gross Margin]</li>
  </ul>

  <h3>🛍️ Overheads</h3>
  <ul>
   <li>[Overview of Overheads, including total amount, change from previous month, and percentage change]</li>
   <li>[Highlight the one most Significant change in Overhead subcategories, with specific amount and percentage change]</li>
  </ul>

  <h2>🏦 Net Profit and Retained Earnings</h2>
  <ul>
   <li>[Key point about net profit and retained earnings]</li>
   <li>[Explanation of how changes in Revenue, direct costs and Overheads, including significant transactions, have impacted Net Profit and Retained Earnings]</li>
  </ul>

  Ensure that the Executive Summary provides a high-level overview of the most important points from your detailed analysis, including the impact of any significant or anomalous transactions.
Key aspects of the prompt include:
-
Context Provision: The prompt includes processed financial data, account group details, and cost change analysis.
-
Specific Instructions: It provides clear guidelines on what to focus on in the analysis, such as revenue, cost of delivery, and significant transactions.
-
Output Structuring: The prompt specifies the desired HTML structure for the output, ensuring a consistent and well-organized report.
-
Analytical Guidance: It provides guidance on how to approach the analysis, including comparing current performance to previous periods and identifying significant changes.
-
Customized Formatting: Instructions for using specific styles and tags in the output are included.
The notebook example also stores the calculation table output and the commentary in a BigQuery table so that we can then include it in our Looker financial dashboard to run alongside our actual monthly P&L report, using a Looker custom visualization we’ve developed that allows us to display the formatted HTML that our LLM produces.
In our internal version of this notebook we’ve also extended the financial analysis performed by the notebook and LLM to include highlighting new recurring payments, forecasting our cashflow for the coming months and other key parts of our monthly financial reporting process.
For more examples of what we’re currently doing with GenAI within Rittman Analytics check out our other blogs below:
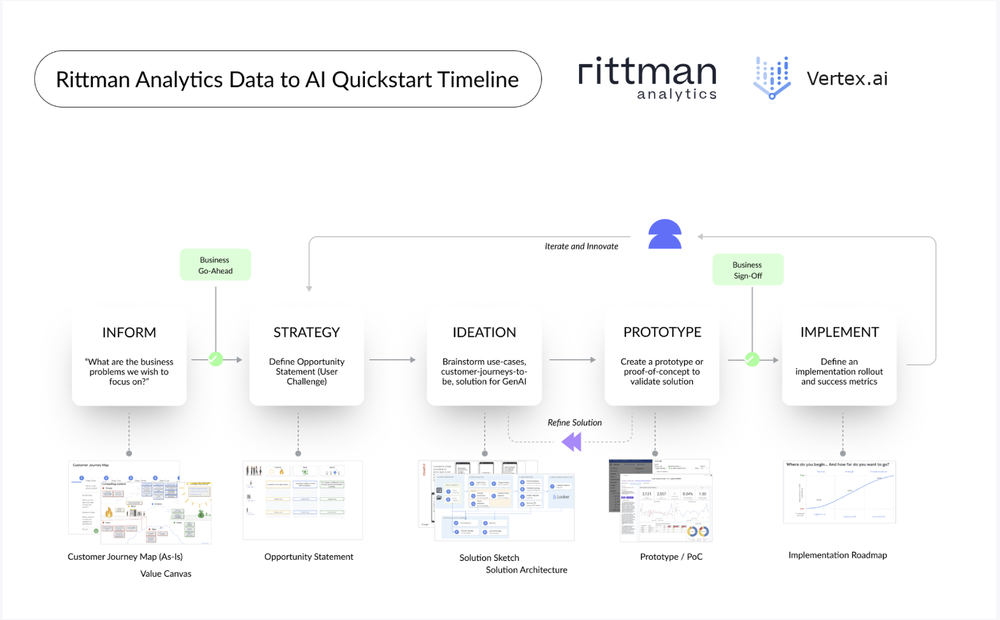
or take a look at our Generative AI services page and our fixed-price, Jumpstart GenAI and Looker consulting package that can deliver these types of AI-powered dashboards for your organization, now!
INTERESTED? FIND OUT MORE!
Rittman Analytics is a boutique data analytics consultancy that helps ambitious, digital-native businesses scale-up their approach to data, analytics and generative AI.
We’re authorised delivery partners for Google Cloud along with Oracle, Segment, Cube, Dagster, Preset, dbt Labs and Fivetran and are experts at helping you design an analytics solution that’s right for your organisation’s needs, use-cases and budget and working with you and your data team to successfully implement it.
If you’re looking for some help and assistance with your AI initiative or would just like to talk shop and share ideas and thoughts on what’s going on in your organisation and the wider data analytics world, contact us now to organise a 100%-free, no-obligation call — we’d love to hear from you!
Recommended Posts
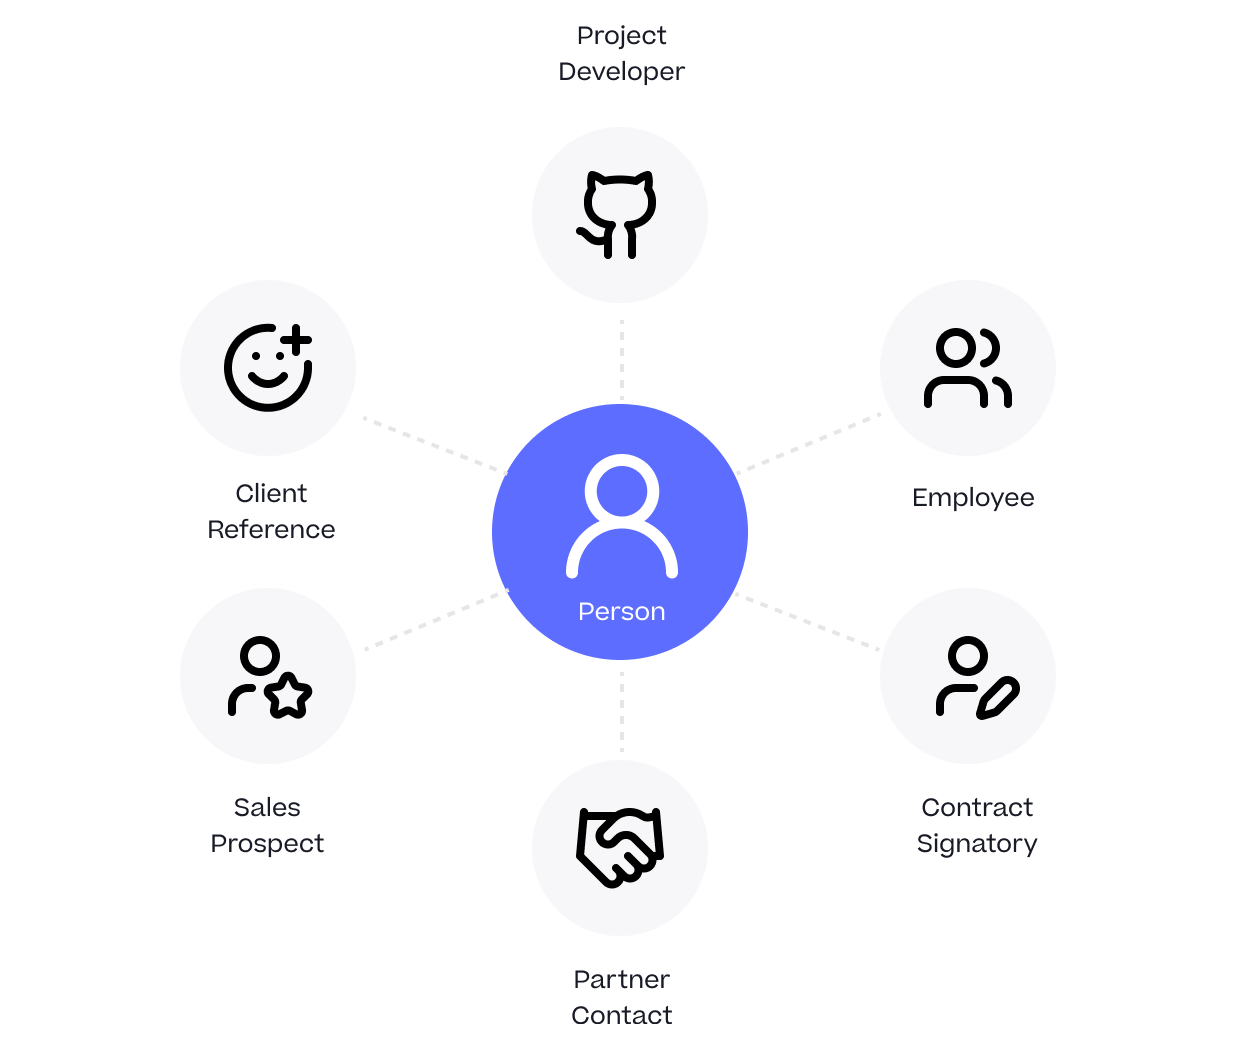
One Person Many Roles: Designing a Unified Person Dimension in Google BigQuery
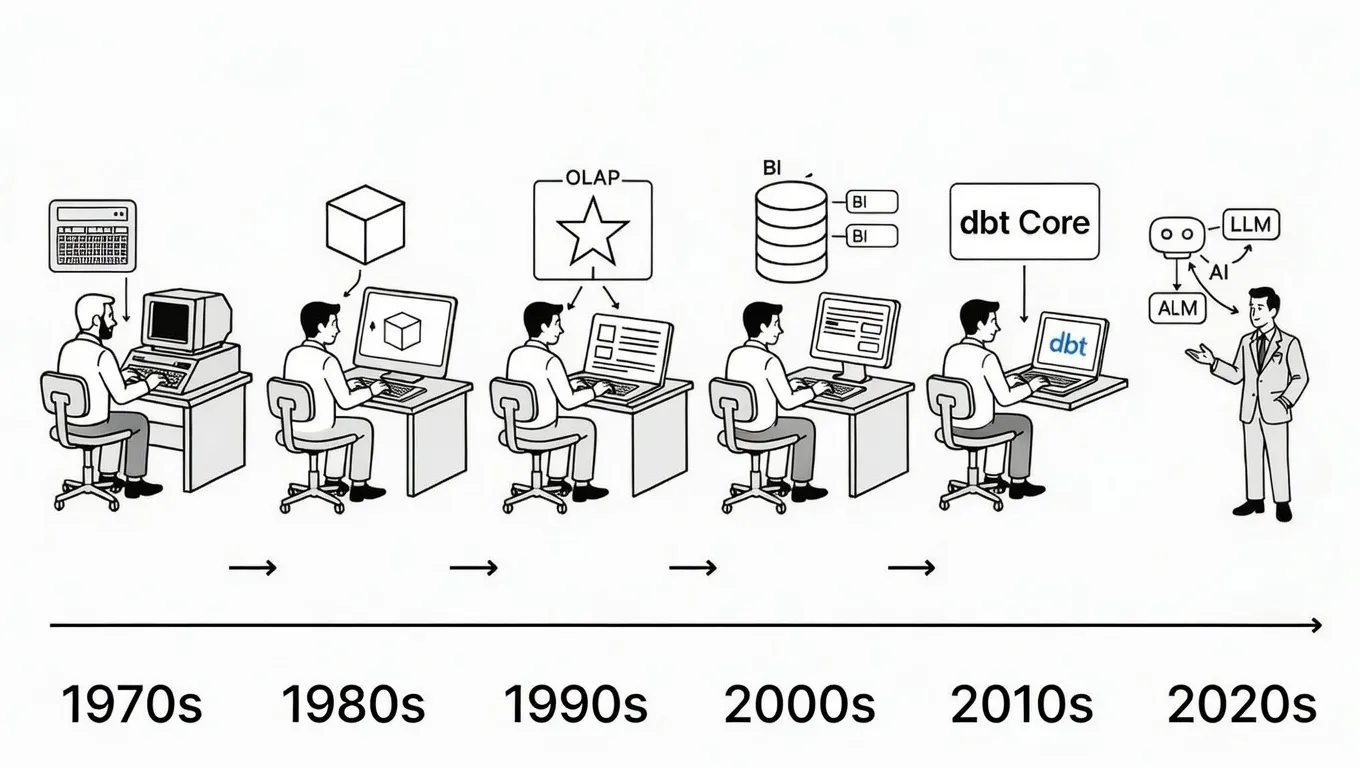
Why We’ve Tried to Replace Data Analytics Developers Every Decade Since 1974
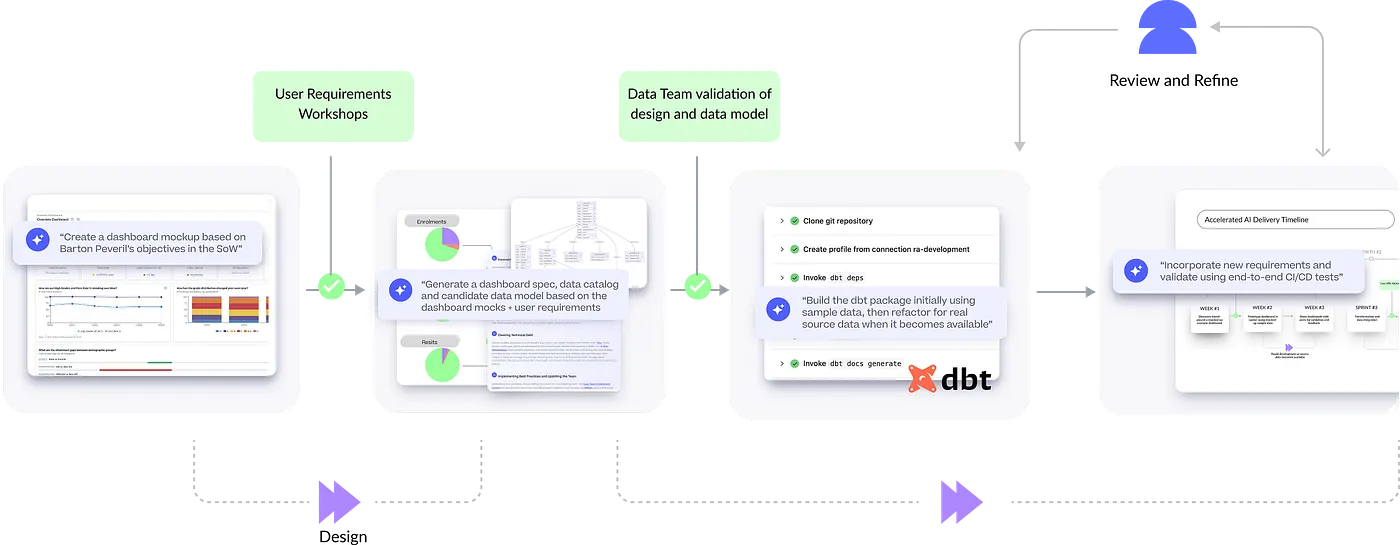
How Rittman Analytics uses AI-Augmented Project Delivery to Provide Value to Users, Faster