Discover the Underlying Drivers of Multichannel Retail Sales Performance with BigQuery BQML Contribution Analysis and Looker Studio
Google BigQuery recently introduced a pre-GA preview of Contribution Analysis, an BQML feature designed to help analysts uncover the drivers of change in key business metrics. By comparing test and control datasets, Contribution Analysis identifies which segments—defined by combinations of attributes like region, channel, or promotion type—have the most statistically significant impact on the metric being evaluated.
Rooted in principles of multivariate analysis and hypothesis testing, this feature brings structured insights into areas that often rely on intuition or extensive manual effort. Contribution Analysis leverages statistical methods such as apriori pruning and unexpected difference detection to provide actionable insights, enabling businesses to focus on the factors that truly influence performance.
By incorporating this feature into your analytical workflows you can move beyond surface-level analytics to understand the deeper, multi-dimensional drivers of business outcomes. Whether optimising marketing campaigns, diagnosing operational inefficiencies, or evaluating test experiments, Contribution Analysis provides a principled framework for answering the “why” behind performance shifts.
Using Contribution Analysis to Understand Factors Influencing Your Sales Performance
To illustrate how BigQuery's Contribution Analysis works in practice, let's consider a scenario where a multi-channel retail business has noticed a decline in overall basket value over the past quarter. The business operates both online and in-store channels across several regions, frequently running targeted promotions to boost sales and is struggling to pinpoint the underlying reasons for the drop in performance.
Regular trend analysis techniques using SQL or a tool such as Looker will tell you that sales are down, but falls short of isolating the combinations of factors—such as promotions in certain regions or specific channels—that are contributing to the decline. Without understanding the drivers, efforts to reverse the trend can risk being poorly targeted or ineffective.
Contribution analysis, in-contrast, segments the data across dimensions like channel, region, and promotion status and compare revenue performance between test (current quarter) and control (previous quarter) datasets. The analysis will reveal which segments are contributing the most to the observed changes in basket value, enabling the retailer to prioritise interventions where they are likely to have the greatest impact.
Let’s start by generating some synthetic ecommerce transaction data with this test/control split:
-- Step 1: Create the Dataset
CREATE SCHEMA IF NOT EXISTS retail_demo;

-- Step 2: Create the Transactions Table with `is_test` defined by Q3 (control) and Q4 (test)
CREATE OR REPLACE TABLE retail_demo.transactions AS
WITH synthetic_data AS (
  SELECT
    GENERATE_TIMESTAMP_ARRAY('2023-01-01 00:00:00', '2023-12-31 23:59:59', INTERVAL 1 HOUR) AS timestamps
),
expanded_data AS (
  SELECT
    TIMESTAMP_TRUNC(ts, DAY) AS transaction_date,
    CONCAT('customer_', CAST(CEIL(RAND() * 1000) AS STRING)) AS customer_id,
    CONCAT('product_', CAST(CEIL(RAND() * 100) AS STRING)) AS product_id,
    CONCAT('store_', CAST(CEIL(RAND() * 10) AS STRING)) AS store_id,
    CASE
      WHEN RAND() < 0.7 THEN 'in-store'
      ELSE 'online'
    END AS channel,
    CASE
      WHEN RAND() < 0.5 THEN 'region_1'
      ELSE 'region_2'
    END AS region,
    CAST(10 + RAND() * 90 AS NUMERIC) AS unit_price,
    CAST(1 + RAND() * 5 AS INT64) AS quantity,
    CAST(100 + RAND() * 500 AS NUMERIC) AS basket_value,
    RAND() < 0.3 AS is_promotion,
    -- Split by quarter: Q1-Q3 is control, Q4 is test
    CASE
      WHEN EXTRACT(QUARTER FROM ts) = 4 THEN TRUE
      ELSE FALSE
    END AS is_test
  FROM UNNEST(GENERATE_TIMESTAMP_ARRAY('2023-01-01 00:00:00', '2023-12-31 23:59:59', INTERVAL 1 HOUR)) ts
)
SELECT
  transaction_date,
  customer_id,
  product_id,
  store_id,
  channel,
  region,
  unit_price,
  quantity,
  basket_value,
  is_promotion,
  is_test
FROM expanded_data
WHERE RAND() < 0.2; -- Reduce the dataset size for faster querying in demos
The syntax for the CREATE MODEL command used to create the contribution analysis model is as follows:
CREATE OR REPLACE MODEL retail_demo.contribution_analysis
OPTIONS(
  model_type='contribution_analysis',
  contribution_metric='SUM(basket_value)',   -- Metric column as a summable metric
  is_test_col='is_test',                    -- Column indicating test/control rows
  dimension_id_cols=['region', 'is_promotion', 'channel']  -- Dimension columns
)
AS
SELECT
  region,               -- Dimension 1
  is_promotion,         -- Dimension 2
  channel,              -- Dimension 3
  basket_value,         -- Metric column
  is_test               -- Test/Control column
FROM retail_demo.transactions;
where the parameter values are:
-
model_type:'contribution_analysis'– Specifies the type of model to create. -
contribution_metric:'SUM(basket_value)'– The metric being analysed, defined as a summable expression. -
is_test_col:'is_test'– Column indicating whether a row belongs to the test or control group. -
dimension_id_cols:['region', 'is_promotion', 'channel']– Columns used to define data segments for analysis.
Interpreting the Contribution Analysis Model Output using BigQuery Studio and Looker Studio
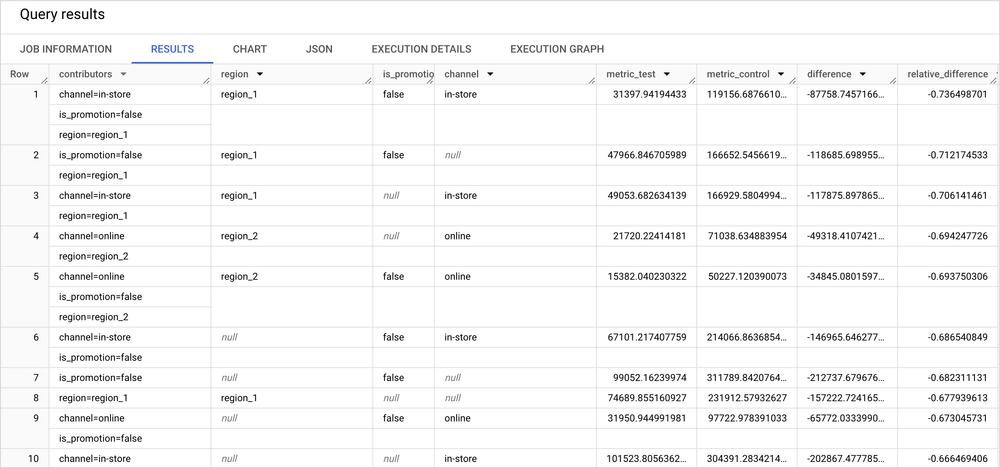
You can then use the ML.GET_INSIGHTS BQML function to start interpreting the contribution analysis results. Running the command below retrieves the top 10 data segments with the largest absolute relative differences in basket value between the test and control groups, helping you identify the most impactful changes.
SELECT contributors, region, is_promotion, channel, metric_test, metric_control, difference, relative_difference
FROM ML.GET_INSIGHTS(MODEL retail_demo.contribution_analysis)
ORDER BY ABS(relative_difference) DESC
LIMIT 10;
The output includes each segment (defined by combinations of region, is_promotion, and channel), the basket value metrics for both test and control groups, and the absolute and relative differences. By ordering the results by ABS(relative_difference), this query surfaces the segments that contributed the most—positively or negatively—to changes in basket value, providing a clear starting point for targeted interventions or further analysis.
To make it easier to identify the segments of interest, you can also export the model output results to Looker Studio directly from BigQuery Studio and then create a pivot table heatmap to provides a visual representation of segment performance, with colour-coding to highlight the relative impact of different segments (contributors) on the relative_difference and difference metrics. This enables you to:
-
Identify segments with the most significant negative or positive contributions.
-
Focus on high-impact areas (segments with darker colour intensity).
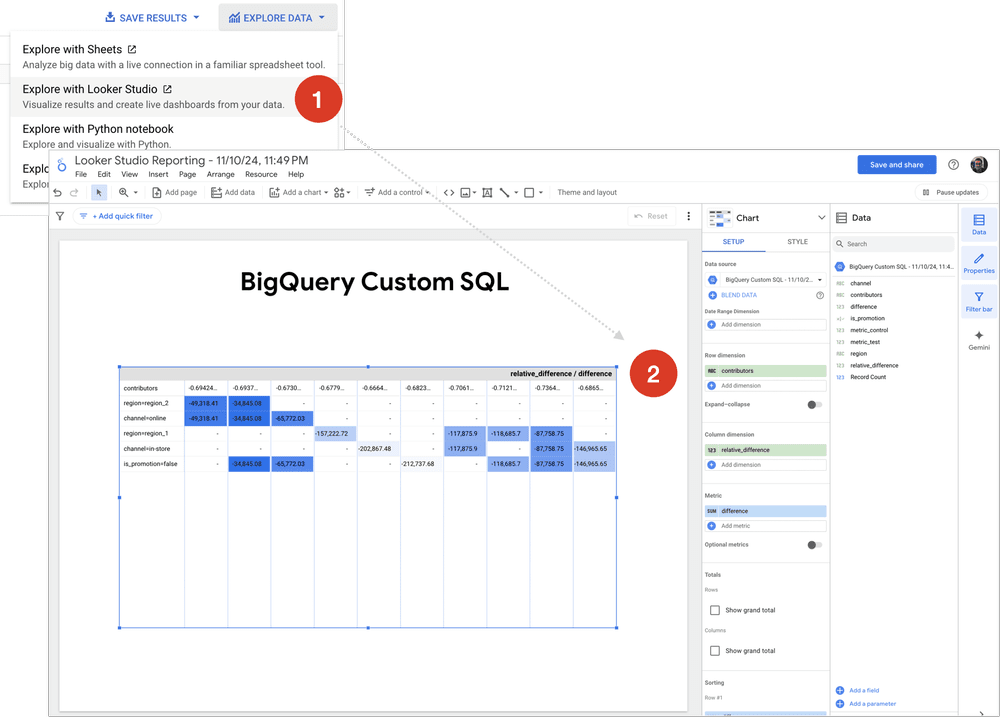
Looking at the resulting visualization we can see that:
-
Colour-Coding: Darker shades represent segments with larger absolute values in
relative_differenceordifference, indicating greater impact; for example the segment[channel=in-store, is_promotion=false, region=region_1]is highlighted because it has a large negative relative difference (-0.7364), which suggests a steep decline in basket value in that segment during the test period. -
Segment Highlights: Segments like
[channel=in-store]and[is_promotion=false]consistently show large negative contributions, suggesting widespread underperformance in these dimensions and the repeated highlighting ofregion=region_1andchannel=in-storeindicates these are recurring problem areas across multiple dimensions. -
Key Dimensions: The heatmap allows us to compare the impact across dimensions; for example
channel=in-storeappears more negatively impacted compared tochannel=onlineand the absence of promotions (is_promotion=false) is strongly associated with performance declines.
And finally, with these observations we can start to formulate appropriate actions, such as:
-
To investigate in-store performance issues, particularly in
region=region_1, and consider implementing targeted promotions to drive sales. -
The absence of promotions (
is_promotion=false) strongly correlates with underperformance and we should consider reintroducing or optimise promotions in affected segments. -
Conduct a deeper dive into
region=region_1as it appears repeatedly across multiple contributors, to identify potential root causes, such as competition or local economic factors.
INTERESTED? FIND OUT MORE!
Rittman Analytics is a boutique data analytics consultancy that helps ambitious, digital-native businesses scale-up their approach to data, analytics and generative AI.
We’re authorised delivery partners for Google Cloud along with Oracle, Segment, Cube, Dagster, Preset, dbt Labs and Fivetran and are experts at helping you design an analytics solution that’s right for your organisation’s needs, use-cases and budget and working with you and your data team to successfully implement it.
If you’re looking for some help and assistance with your AI initiative or would just like to talk shop and share ideas and thoughts on what’s going on in your organisation and the wider data analytics world, contact us now to organise a 100%-free, no-obligation call — we’d love to hear from you!
Recommended Posts
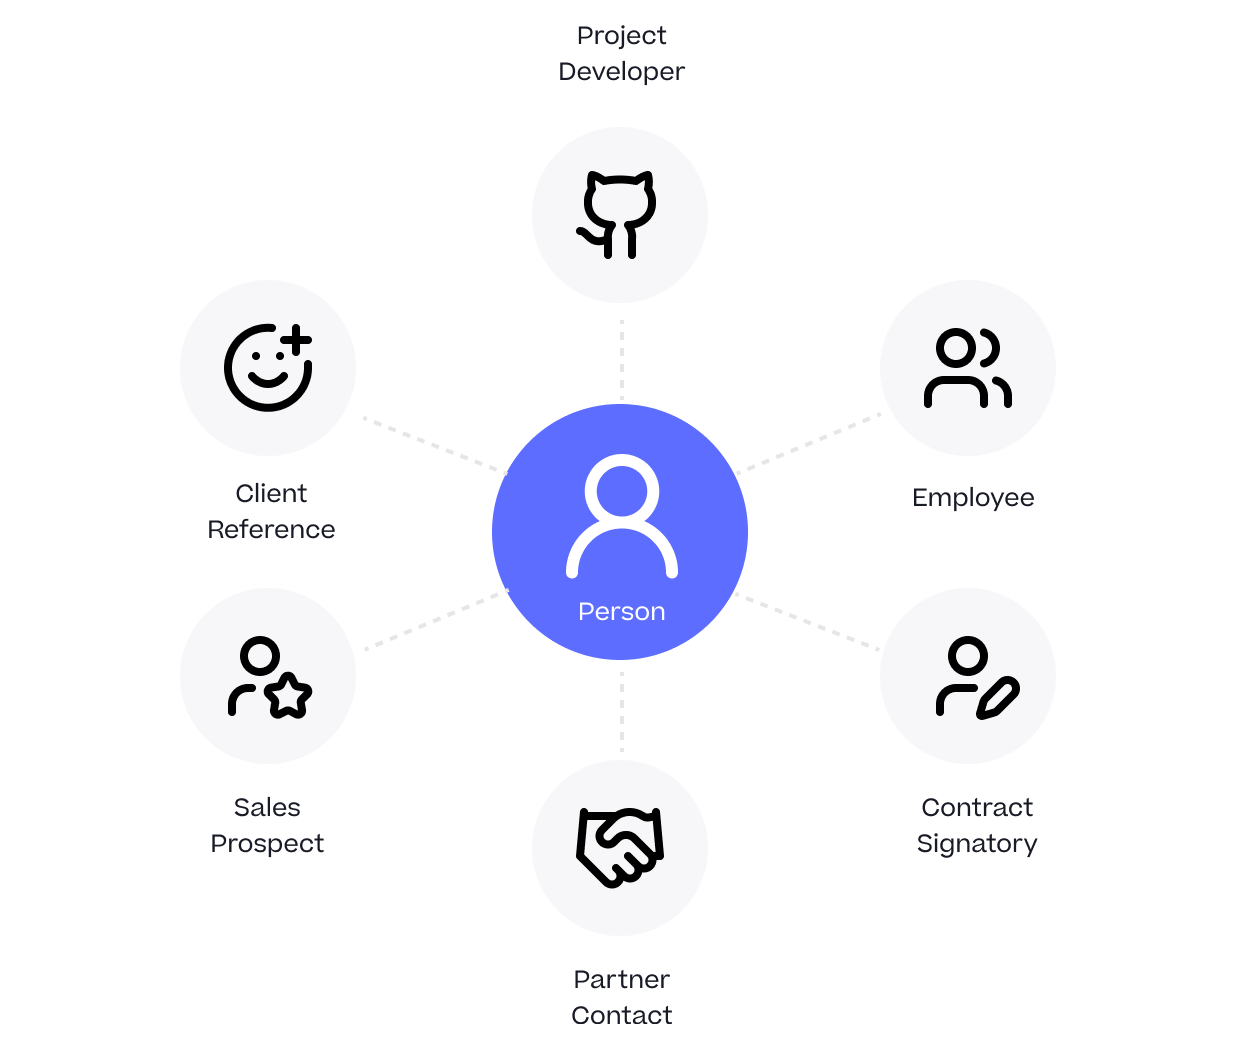
One Person Many Roles: Designing a Unified Person Dimension in Google BigQuery
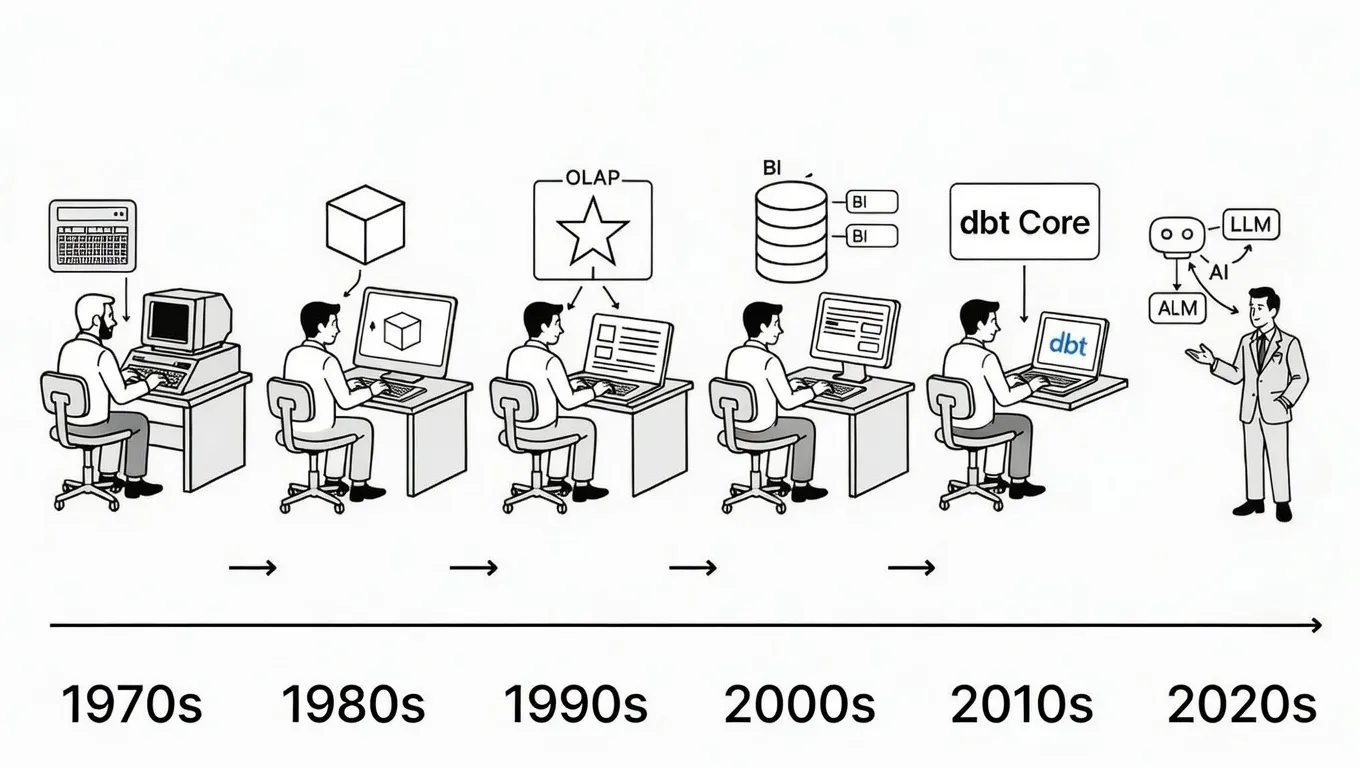
Why We’ve Tried to Replace Data Analytics Developers Every Decade Since 1974
How Rittman Analytics uses AI-Augmented Project Delivery to Provide Value to Users, Faster