Coalesce 2024 and the Launch of dbt’s Visual Editing Experience
This week has seen Coalesce 2024, the analytics engineering conference organized by dbt Labs, running in Las Vegas and thanks again to Tristan and the team for putting on such a great event.
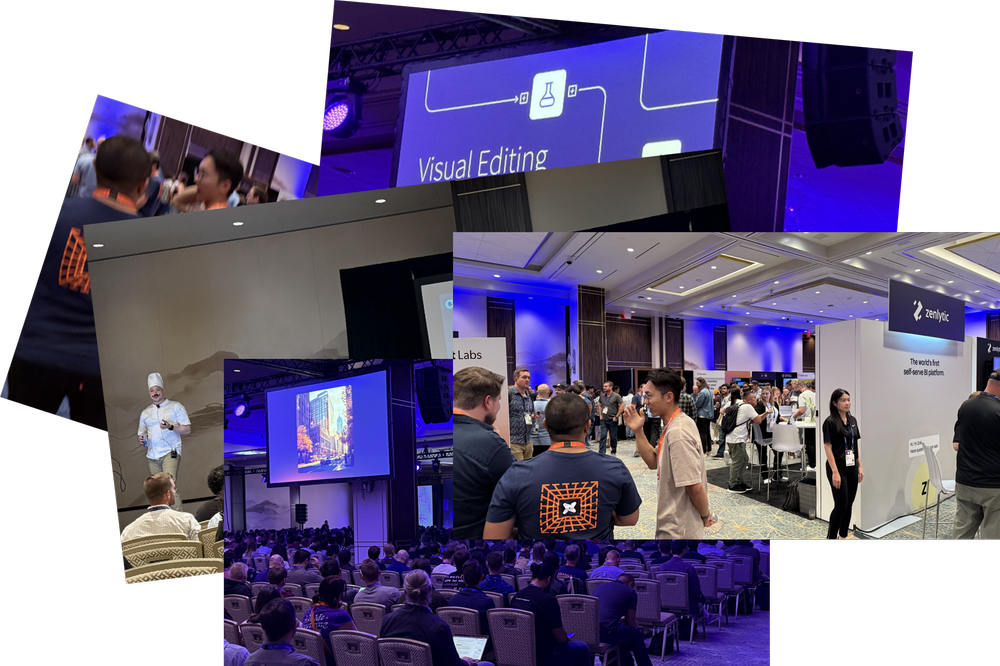
I won’t go into all the new product features introduced this week (this page on the dbt Labs website contains a good summary) but that did get my attention was the announcement of the soon-to-be-released Visual Editor, positioned as an alternative to the command-line and web-based IDEs for “non-technical” data analyst users who want to view, amend and potentially build their own dbt models and transformations.
What we saw was an early pre-release version of the Visual Editor where the goal was to be able to visualise, as far as possible, any dbt package and as you can see in the screenshot below, visualize the business logic for the model transformation in the form of source, join, aggregate and filter operators.

This Visual Editor is being positioned as a third option for editing and visualizing dbt models and packages alongside the already existing dbt Cloud CLI (an extended version of the dbt Core command-line interface that submits and runs dbt jobs using dbt Cloud, not your laptop) and the dbt Cloud IDE, a web-hosted VS Code-like tool for code-based editing of dbt models, macros and packages.
dbt Cloud’s Visual Editor is aimed at “non-technical” users who want to inspect and understand the details of the dbt models and potentially participate in their customization, extension or even development of new models in their own development environment.
The goal of the initial release is to be able to visualize and inspect the contents of any dbt package, though the extent to which you’ll be able to do so will be limited in the first release to “80% of the highest-value SQL operators”:
Join, filter, limit, aggregate and formula operators to create your models and transformation logic
No ability to edit or create macros or custom functions
No ability to add or generate tests, unit tests, semantic models
You can see in the clip below a demonstration of the Visual Editor being used to define a join between two tables used in the definition of a dbt model, with the set of model operators visible on the far left-hand side of the screen.
The Visual Editor also comes with features for data model management such as version control and collaboration capabilities, designed to help users track changes, manage permissions, and collaborate effectively; it alsol, of course, also comes with AI-driven features designed to help automate your SQL code generation and assist in data discovery.
What’s Old is Now New
Of course if you’ve been in this industry for a few years then this type of drag-and-drop interface is nothing new — my article from 2006 on Oracle Warehouse Builder goes through a tool that, like Visual Editor, creates SQL-based transformations from mapping designs created using a drag-and-drop editor and its user interface and functionality is, frankly, years ahead of what dbt Labs are planning on putting-out in their first release as I commented to a friend in the industry while at the Visual Editor launch.

But dbt’s Visual Editor is an improvement on these old tools in one significant way, discounting for now the AI features planned for Visual Editor that wouldn’t have been possible in those earlier tools twenty years ago.
This improvement is probably second-nature to most dbt users but it would would have been seen as a miracle back back then; the ability to use a proper version control tool to branch, version-control and merge changes back into a central repository.
Back in those days tools used to store their project repositories in a relational database (because, if you’re a vendor like Oracle, *everything* gets stored in a relational database) but doing this precluded the use of any of the version control tools of the time (VSS, SVN and just emerging, git) leaving us instead with the universally-terrible snapshotting and versioning features built-into the tools by the vendors themselves.

Visual Editor, by contrast, stores your model and other project artifacts as plain text SQL and YAML files version-controlled via git, and moreover it reads-and-writes regular dbt package files giving you the option to develop part of your project graphically, then switch to the command-line for the more complex parts and then switch-back to the graphical tool, a workflow none of the old-world tools supported.
But What Does This All Mean for “dbt, the Project”?
The launch of the visual editor did leave me with a couple of unanswered questions though, the first around the target audience and the second to do with the direction of the overarching “dbt project” in-general.
In my experience, making a development tool graphical and drag-and-drop doesn’t by itself make it suitable for use by non-technical users. Where I do see successful use of this type of interface is in data prep tools such as Trifacta/Google Cloud DataPrep but they tend to be single-user systems with minimal software development lifecycle features.
Getting business users to understand PRs, dev branches and so on is a bit of a tall order and it was always developers, not business users, that used those old graphical drag-and-drop tools back in the days of Informatica and Warehouse Builder.
The second, more existential question for me though is what the Visual Editor means for the dbt philosophy as-a-whole. dbt has always until now been about the rich expressiveness and development efficiency you only get when developing your data assets using code and modern software development lifecycle tools, and this appealed to folks like me who were sick of the old way of doing things and knew how the drag-and-drop, lowered barriers-to-entry approach could go wrong.
It’s obvious why dbt Labs are introducing the Visual Editor; requiring coding skills by definition limits the market for your products and when you’ve raised the amount of money dbt Labs has, you need a TAM that goes beyond early-adopters in digital-first business.
But, inevitably and if the Visual Editor team do their job well, it rather than the dbt Cloud CLI and IDE will become the default way that new dbt users will learn to use the product. And where, then, does that leave dbt and its differentiation from all the other drag-and-drop tools like Alteryx, Talend and Coalesce?
And while we’re on this topic, does dbt Labs’s new positioning of dbt Cloud as the “Data Control Plane that centralizes metadata across the ADLC — orchestration, observability, cataloging, and more” is a pure middleware play, giving dbt Labs’ sales team lots of upsell and cross-sell opportunities at the enterprise customers they’re now focusing on, but again where is the differentiation?

That said, dbt Labs and Rittman Analytics started at around the same time in 2016 and while they’re running a superb conference in Las Vegas with thousands attending and ARR heading towards $100M/year, we could still fit our team in a mini-bus and have space for the luggage in the back.
So well done to Tristan, the Visual Editor development team and everyone else at dbt Labs, we’re eagerly looking forward to how these features and dbt in-general pan-out over the coming years.
Interested? Find Out More
Rittman Analytics is a boutique data analytics consultancy that helps ambitious, digital-native businesses scale-up their approach to data, analytics and generative AI.
We’re authorised delivery partners for Google Cloud along with Oracle, Segment, Cube, Dagster, Preset, dbt Labs and Fivetran and are experts at helping you design an analytics solution that’s right for your organisation’s needs, use-cases and budget and working with you and your data team to successfully implement it.
If you’re looking for some help and assistance with your dbt implementation or would just like to talk shop and share ideas and thoughts on what’s going on in your organisation and the wider data analytics world, contact us now to organise a 100%-free, no-obligation call — we’d love to hear from you!
Recommended Posts
One Person Many Roles: Designing a Unified Person Dimension in Google BigQuery
Why We’ve Tried to Replace Data Analytics Developers Every Decade Since 1974
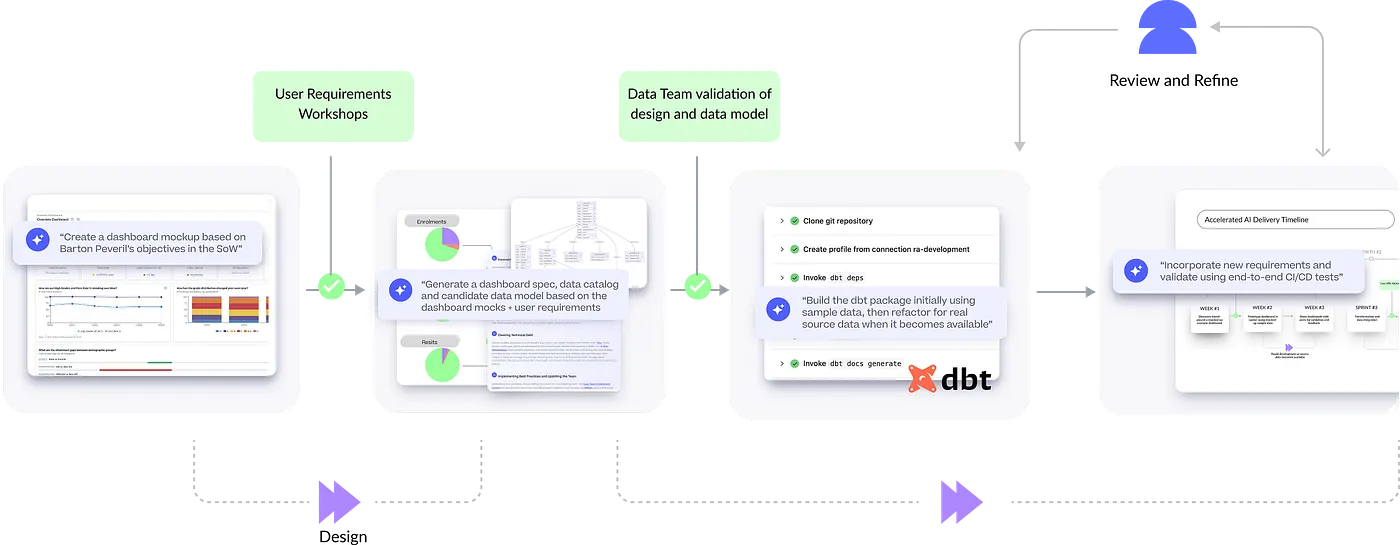
How Rittman Analytics uses AI-Augmented Project Delivery to Provide Value to Users, Faster
