Analyzing your Historical Revenue & Sales Pipeline Over-Time using Google BigQuery, Fivetran, Stitch and Looker | by Mark Rittman | Rittman Analytics Blog
For a consulting business such as Rittman Analytics, revenue pipeline analysis plays a crucial role in understanding the health and sustainability of our project delivery and sales efforts.
Traditional sales and revenue trend analysis, such as the project revenue over time chart displayed below, can tell you how well the our business has performed in terms of revenue billed or contracts won, but it does not provide insights into future project work that has already been booked but not yet delivered or potential revenue still in the sales pipeline that may close soon.
Data from our client engagements is extracted from Hubspot, Harvest and Xero and centralized in our Google BigQuery cloud data warehouse as we’ve blogged about in How Rittman Analytics does Analytics Part 2 : Building our Modern Data Stack using dbt, Google BigQuery, Looker, Segment and Rudderstack and Data Lakehouses, Post-Modern Data Stacks and Enabling Gen AI: The Rittman Analytics Guide to Modernising Data Analytics in 2024.
To calculate and analyze our booked revenue pipeline we use dbt and BigQuery SQL to break down each engagement into monthly revenue increments, then for each of those months calculate the the total remaining revenue in these four steps:
- We generate an array of months that each engagement runs over, taking us from an engagement record with a start and end date to multiple rows, one per month, that we can then allocate revenue over.
WITH date_series AS (
 SELECT
 timesheet_project_pk,
 DATE_TRUNC(date, MONTH) AS month_start,
 DATE_TRUNC(date, MONTH) + INTERVAL 1 MONTH - INTERVAL 1 DAY AS month_end,
 FROM
 projects_by_engagement,
 UNNEST(GENERATE_DATE_ARRAY(DATE(project_delivery_start_ts), DATE(project_delivery_end_ts), INTERVAL 1 DAY)) AS date
 GROUP BY
 1, 2, 3
2. Once we have this array of months we then calculate the number of business days within those months, which we then use when allocating the total engagement revenue proportionately across the months and days the engagement runs-over.
WITH monthly_business_days AS (
 SELECT
 d.timesheet_project_pk,
 engagement_code,
 d.month_start,
 d.month_end,
 p.project_name,
 p.company_name,
 p.project_delivery_start_ts,
 p.project_delivery_end_ts,
 p.total_recognized_revenue_per_working_day,
 COUNT(DISTINCT IF(EXTRACT(DAYOFWEEK FROM date) NOT IN (1, 7) AND date >= DATE(p.project_delivery_start_ts) AND date <= DATE(p.project_delivery_end_ts), date, NULL)) AS business_days_in_month
 FROM
 date_series d
 JOIN
 projects_by_engagement p ON d.timesheet_project_pk = p.timesheet_project_pk
 LEFT JOIN
 UNNEST(GENERATE_DATE_ARRAY(DATE(d.month_start), DATE(d.month_end), INTERVAL 1 DAY)) AS date
 GROUP BY
 1, 2, 3, 4, 5, 6, 7, 8, 9
)
3. Next we use those counts of business days per month to allocate revenue to each of those months, like this:
WITH projects_by_engagement_monthly AS (
 SELECT
 company_name,
 timesheet_project_pk,
 project_name,
 engagement_code,
 month_start,
 project_delivery_start_ts,
 project_delivery_end_ts,
 business_days_in_month,
 total_recognized_revenue_per_working_day,
 ROUND(business_days_in_month * total_recognized_revenue_per_working_day, 2) AS monthly_recognized_revenue
 FROM
 monthly_business_days
)
4. Finally, we use a SUM() OVER () window function to calculate the remaining revenue for each engagement as the months progress and then subtract the cumulative revenue already billed from the total engagement value to give us, per engagement per month, the total remaining unbilled revenue.
WITH engagement_monthly_revenue AS (
 SELECT
 company_name,
 engagement_code,
 month_start,
 SUM(monthly_recognized_revenue) AS monthly_recognized_revenue
 FROM
 projects_by_engagement_monthly
 GROUP BY 1, 2, 3
)
SELECT
 {{ dbt_utils.surrogate_key(['month_start','engagement_code']) }} AS project_engagement_monthly_revenue_pk,
 company_name,
 engagement_code,
 month_start,
 SUM(monthly_recognized_revenue) OVER (PARTITION BY engagement_code)
 - COALESCE(SUM(monthly_recognized_revenue) OVER (PARTITION BY engagement_code ORDER BY month_start ROWS BETWEEN UNBOUNDED PRECEDING AND 1 PRECEDING), 0) AS total_engagement_revenue_remaining
FROM
 engagement_monthly_revenue
From this SQL analysis we then create three Looker data visualizations:
- Booked Revenue Pipeline Chart that visualizes the total remaining booked revenue by month, giving an at-a-glance view of how much confirmed work our business has in the pipeline for future months.
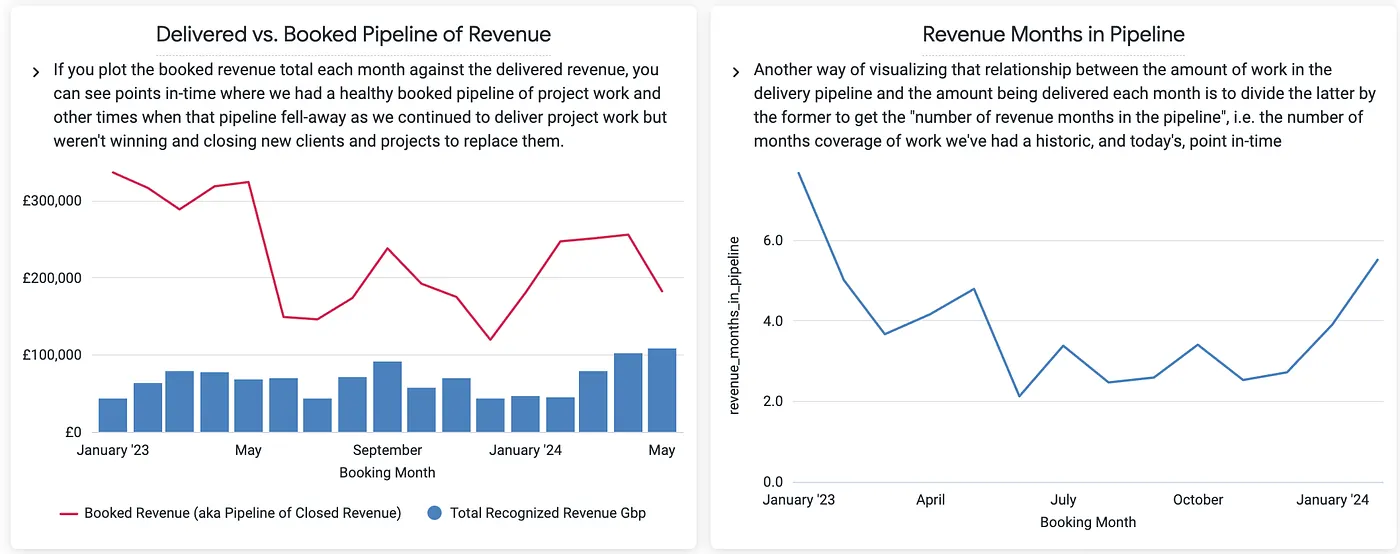
2. Delivered vs. Booked Pipeline Chart and Revenue Months in Pipeline Chart compare the booked revenue against delivered revenue (i.e., the revenue that has already been billed), telling us how fast we are getting-through our backlog of booked projects and showing how long the company’s backlog of work can sustain future revenue.
While the booked revenue pipeline provides a view of our confirmed (booked) project work yet to be delivered, we also need to evaluate our sales pipeline — the potential revenue still in negotiation.
Analyzing this pipeline is critical for understanding future business opportunities and ensuring that our long-term revenue stream remains strong. However, an approach where we rely solely on traditional sales pipeline metrics such as value of new and closed deals per month and tracking all open deals by their current pipeline stage won’t be sufficient because:
- A deal in the early stages of the sales process has a much lower likelihood of closing than a deal in the final negotiation stage. Simply tracking the total value of all deals in the pipeline ignores these probabilities and can lead to inflated expectations about future revenue
- The value of deals in the sales pipeline can shift over time as deals move between stages. Relying on static snapshots of deal value, without accounting for historical progress, does not provide insight into how much potential revenue was in the pipeline at specific points in time.
- Without applying stage-specific weightings to deals, we can’t realistically assess the potential revenue in the pipeline. A deal in the initial meeting stage has a much lower probability of converting into closed revenue than a deal in the negotiation stage and if all deals are treated equally this can lead to an overestimation of our potential future revenue.
Instead we track sales opportunities over time, seeing the total pipeline value at different points in history, including both won, lost, and open opportunities; and we apply stage-specific weights to open deals, adjusting the potential revenue to reflect the historical success rate at each stage.
For example, deals in the initial meeting stage historically have a 30% chance of closing while those in the proposal and negotiation stages have 45% and 60% chance of closing, based on our historical deal data from Hubspot.
To generate our sales pipeline over time we use data extracted from Hubspot using both Fivetran and Stitch and then process it using dbt and Google BigQuery like this:
- First we extract the core deal information, such as the deal’s ID, creation date, and name. We use Fivetran to pull current deal information, including the deal’s stage which we then categorize into a smaller set of stage categories (e.g., Initial Meeting, Needs Analysis, Negotiation) based on their position in the pipeline.
CASE
 WHEN p.display_order <= 2 THEN '1: Initial Meeting'
 WHEN p.display_order BETWEEN 2 AND 3 THEN '2: Needs analysis and proposal'
 WHEN p.display_order BETWEEN 4 AND 7 THEN '3: Negotiation and commitment'
 WHEN p.display_order BETWEEN 8 AND 9 THEN '4: Deal close'
 WHEN p.display_order = 10 THEN '0: Lost'
END AS deal_stage_category
2. Then we make use of deal data extracted via Stitch, another data replication service, which snapshots the pipeline status of each Hubspot deal each time it runs which we then use to calculate the stage of the deal at each month-end.
DATE_TRUNC(DATE(entered_pipeline_stage_ts), MONTH) AS month_name
This allows us to construct a point-in-time view of the sales pipeline, ensuring that we can track the historical position of each deal at month-end as opposed to the current status, today, of that deal. You could equally achieve the same outcome by using dbt’s snapshot feature designed for slowly-changing dimensions or use the from-and-to dates for deal stages that Hubspot provides for deal records.
3. An essential part of analyzing the pipeline is correctly handling closed deals (either won or lost). Deals that have been closed should not appear in future months as part of the open pipeline, but they must be accounted for in the month they closed.
To handle this, the SQL query flags when a deal has reached the “Deal Close” or “Lost” stage. We then sum these closing events and calculate a cumulative sum of those closing event totals to ensure that once a deal is closed, it doesn’t reappear in the pipeline in subsequent months.
SUM(is_closing_events) OVER (PARTITION BY deal_id ORDER BY deal_month_ts RANGE BETWEEN UNBOUNDED PRECEDING AND CURRENT ROW) AS total_closing_events
4. Finally we calculate the deal value at the end of each month using the LAST_VALUE window function, so that we have the most up-to-date value for a deal when the value potentially goes up-or-down during the month
LAST_VALUE(deal_amount_gbp) OVER (PARTITION BY deal_id, month_name ORDER BY entered_pipeline_stage_ts) AS deal_amount_gbp
We then use Looker to visualize our sales pipeline by stage over time using two visualizations:
- Pipeline by Stage Over Time: This chart categorizes the pipeline by stage over time, giving a historical view of the pipeline mix at the end of each month and showing whether the sales pipeline has been predominantly filled with early-stage deals or if more deals are progressing to later stages, such as negotiation and deal close.
2. Deal Pipeline Amount vs. Weighted calculates a weighted deal value for deals in various stages based on their likelihood of closing and helps in forecasting more accurately, showing a realistic value of potential revenue based on the probability of deals closing.
After analyzing both the booked revenue pipeline and the sales pipeline independently, the next step is to combine them in two final Looker visualizatios to get a holistic view of the total revenue pipeline, helping us understand not just the secured work that has been won but also the potential future revenue from deals still in the sales process.
- Total Pipeline by Month merges the data from both the booked revenue pipeline and the sales pipeline (using weighted values for open deals), showing us the total potential revenue for each month made up of both booked revenue and weighted sales opportunities, providing a clear breakdown of how much of the pipeline is secured vs. still being negotiated.
2. Pipeline Booked % vs. Total Pipeline is critical for understanding the balance between booked and unbooked work and the level of risk in the current pipeline. It reveals situations where the total pipeline may appear large, but only a small percentage is actually confirmed which may or may not actually close.
Interested? Find Out More!
Rittman Analytics is a boutique data analytics consultancy that helps ambitious, digital-native businesses scale-up and upgrade their sales, marketing and financial analytics capabilities, just like we’ve done for ourselves in this blog article.
We’re authorised delivery partners for Google Cloud along with Oracle, Segment, Cube, Dagster, Preset, dbt Labs and Fivetran and are experts at helping you build financial analytics and scalable, cloud-hosted data stacks that are designed for your organisation’s needs, use-cases and budget.
If you’re looking for some help and assistance with your sales pipeline reporting or would just like to talk shop and share ideas and thoughts on what’s going on in your organisation and the wider data analytics world, contact us now to organise a 100%-free, no-obligation call — we’d love to hear from you!
Recommended Posts
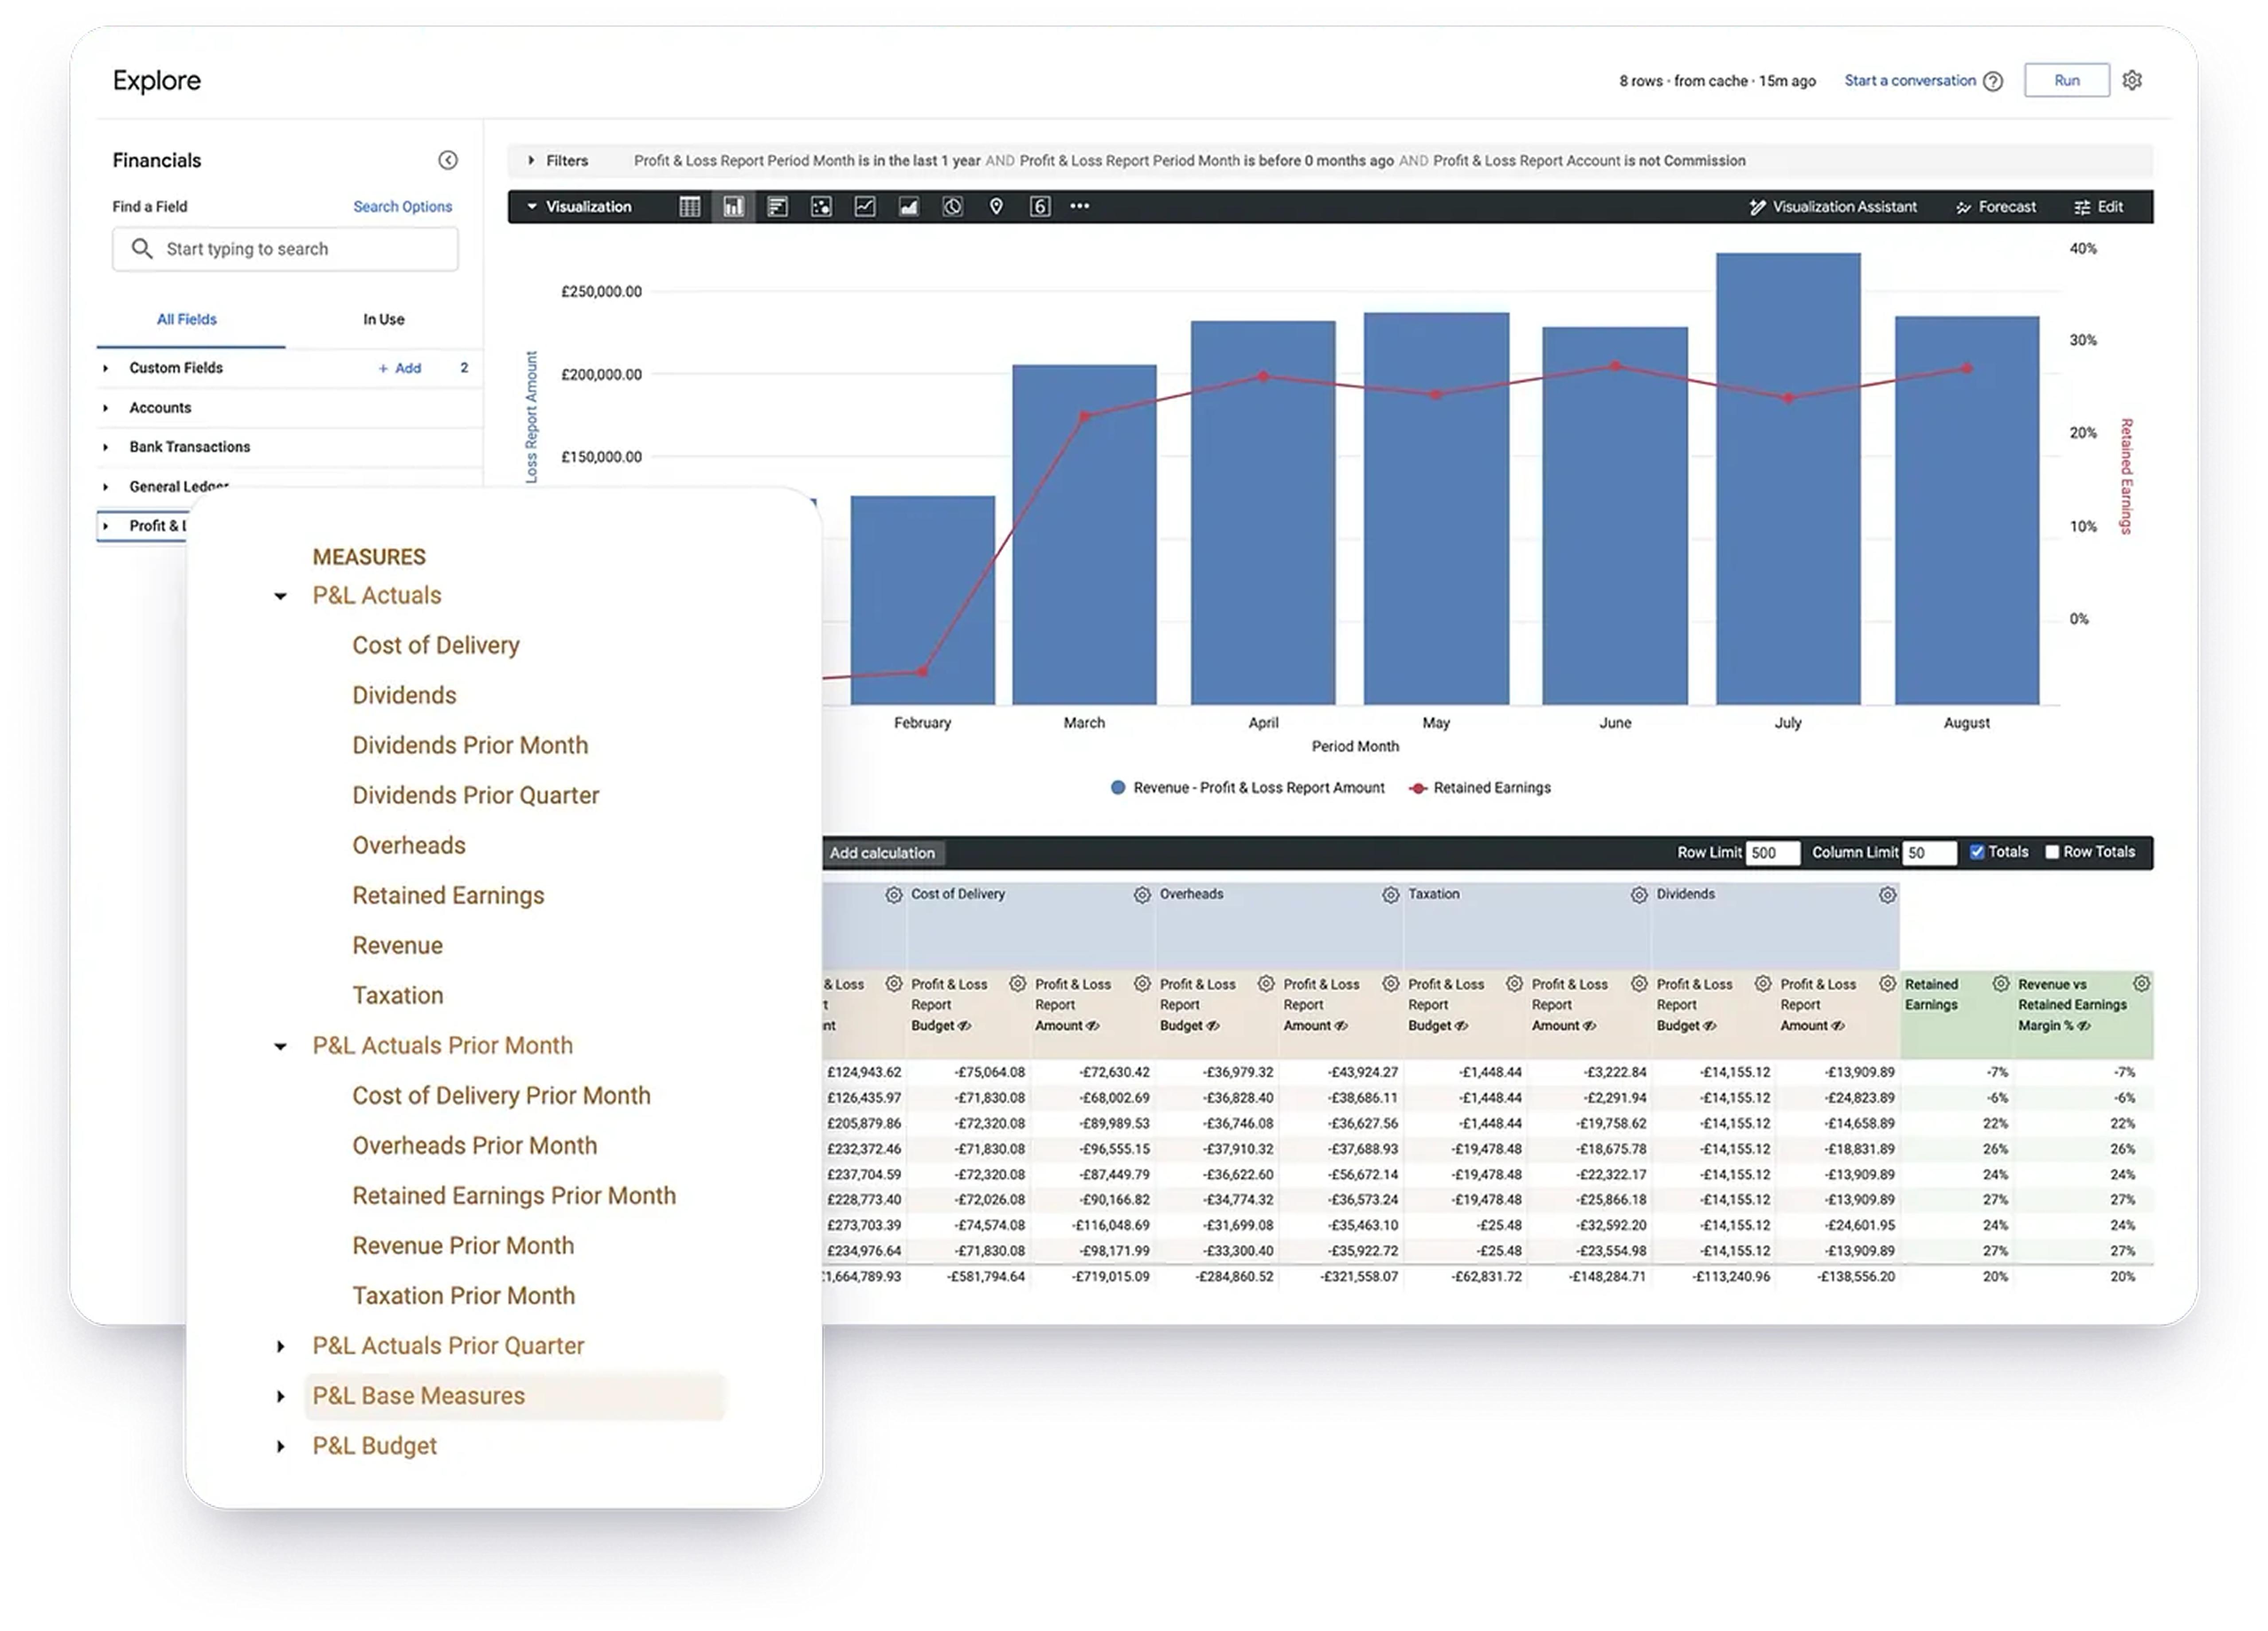
How Rittman Analytics Does Financial Analytics using Looker, Fivetran and Google BigQuery
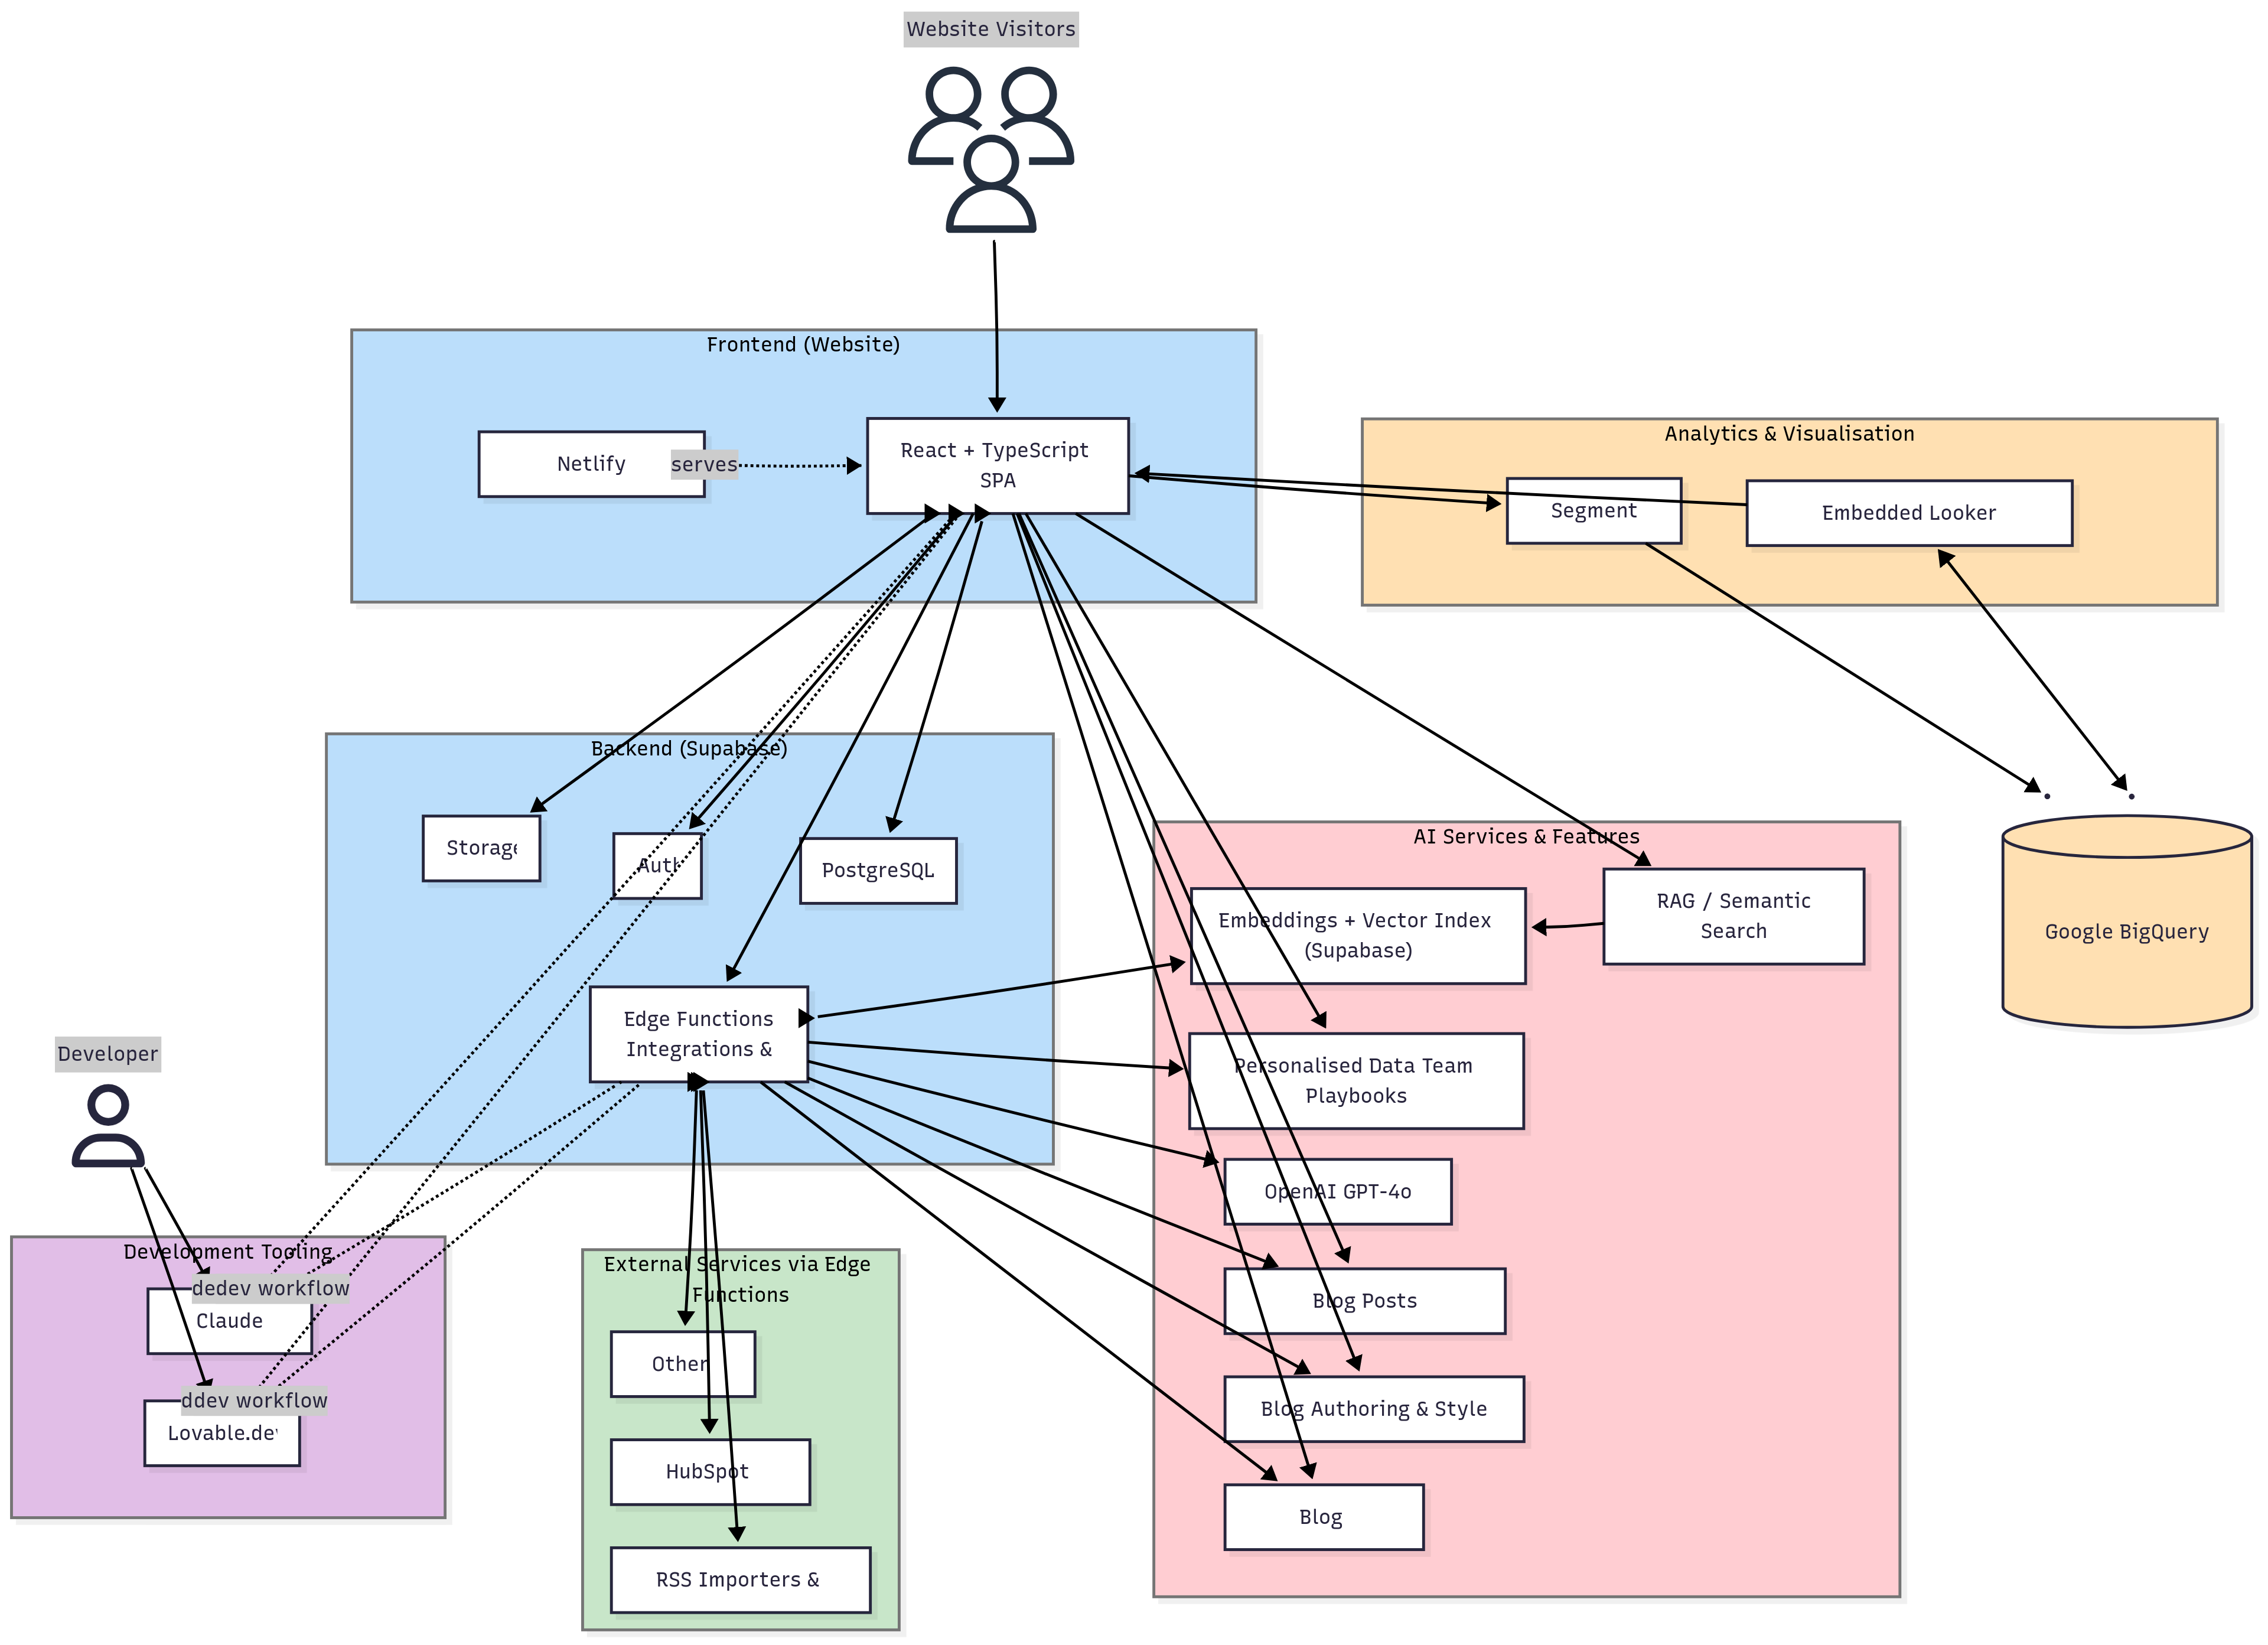
Opinionated, AI-Enabled & Modern: The Story Behind Rittman Analytics’ New Website
Analyzing your Historical Revenue & Sales Pipeline Over-Time using Google BigQuery, Fivetran, Stitch and Looker | by Mark Rittman | Rittman Analytics Blog