Lightdash, Looker and dbt as the BI Tool Metrics Layer — Rittman Analytics
One of the more interesting startups to come out of the modern data stack space in the last twelve months is the team behind Lightdash, an open-source alternative to Looker that uses dbt, rather than LookML, to define its semantic model and metrics layer.
Part of a wider trend within the modern data stack of decomposing what historically were monolithic BI tool suites into smaller, more focused components, Lightdash focuses on the end-user experience and leaves the definition of the underlying metrics layer to dbt; initially, through their own specification of meta fields added to standard dbt projects but in the future, through dbt’s own emerging metrics layer specification.
As well as being long-standing Looker and dbt partners we always like to check-out new products in the modern data stack, and so recently implemented Lightdash over a weekend as an internal R&D project on-top of our Google BigQuery and dbt-based internal data warehouse.
Fast-forwarding to the tl;dr I think it’s fair to say that whilst Lightdash is still clearly a fairly primitive BI tool missing a host of features that we would consider table stakes in any serious BI tool evaluation, it’s integration with dbt and the benefits this provides to the developer experience, as well as its alignment with the trend in the industry towards BI tools using separate metrics layers, makes it worth keeping an eye on in-future.
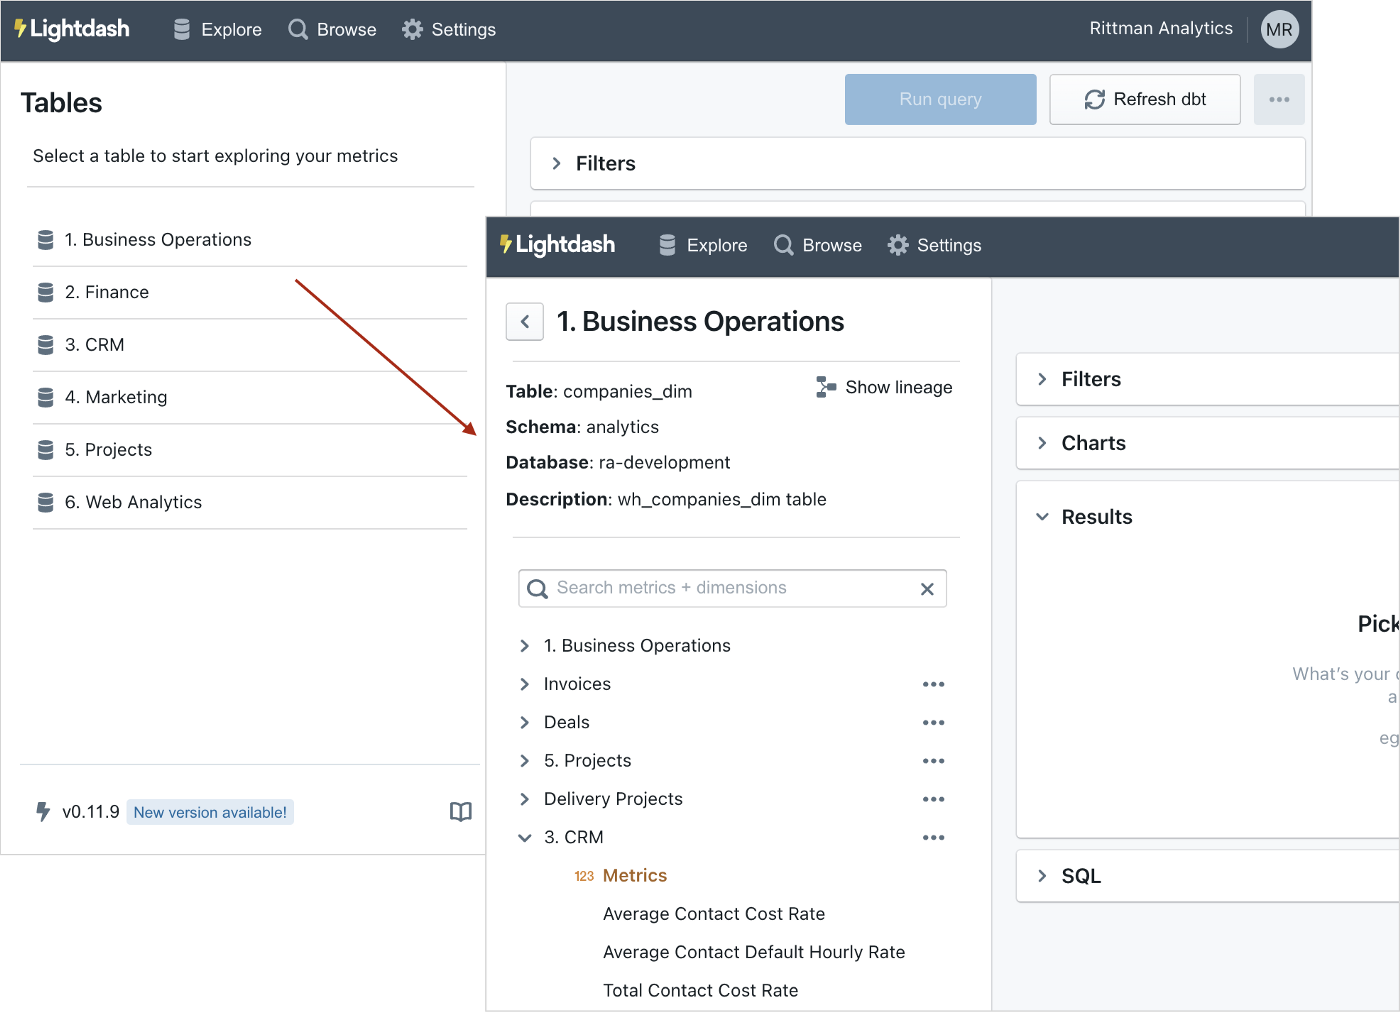
Here it is presenting our six major warehouse subject areas (“explores” in Looker lingo) and then displaying the various warehouse tables that can be joined-to from our main business operations clients table.
So how exactly does it integrate with dbt, and what’s involved in turning dbt into a BI tool’s metrics layer?
Installing and configuring Lightdash requires you either to host it yourself — we chose the one-click Heroku deployment option with a custom subdomain name that points to https://lightdash.rittmananalytics.com, there are also options to run in Docker or manually download and configure it all yourself — or you can join the waitlist for the cloud-hosted, paid option, similar to other open-core/paid-hosted tools such as Superset, Airbyte and so on.
A prerequisite for working with Lightdash is an existing dbt project at version 1.0.0 or higher; ours was at 0.21.1, the terminal release pre-1.0.0 but upgrading wasn’t a big deal and had to do be done at some point anyway,
The way Lightdash works with dbt is for developers to add additional metadata for dimensions and metrics onto existing schema.yml entries for your dbt models, like this for a model column that will become a Lightdash dimension:
- name: campaign_datemeta:dimension:label: "Campaign Date"type: timestamptime_intervals: ['raw','month','year']
and this for a column that will become two Lightdash metrics:
- name: total_reported_costmeta:dimension:label: "Total Reported Cost"type: numberhidden: yesmetrics:total_total_reported_cost:type: sumlabel: "Total Total Reported Cost"avg_total_reported_cost:type: averagelabel: "Average Total Reported Cost"
Note that Lightdash is adding support for dbt-native metric definitions with the first, alpha-stage implemention detailed in the docs here.
The issue we had was that not every model and column we wanted to see in Lightdash had been defined in schema.yml files in our dbt project, not ideal practice but also the reality in most dbt projects I’ve seen over the years. And then, of course, I needed to add potentially dozens of dimension and metric definitions to the schema file before I could start building reports and dashboards in the Lightdash tool.
Whilst there are a number of examples of SQL being used to auto-generate schema.yml files along with Python packages such as our own droughty, what I needed was something that also added the dimension and metric definitions to those schema entries. By using the datatype of each column and some basic column naming rules it should be possible to auto-generate at least a basic, starter version of a metrics layer for our warehouse that I could then fine-tune and enhance as time went on.
I’ve shared the first pass at doing this in a standalone git repository which contains a single dbt macro called using dbt run-operation, along with parameter values for the warehouse schema, model prefix and primary key column prefix values (if needed).
dbt run-operation generate_metrics_schema --args '{table_schema: analytics, model_prefix: wh_, pk_suffix: _pk}'
The macro then outputs a SQL statement that you can run either through the BigQuery Web UI or bq CLI command to in-turn create the schema.yml file, or you can wrap both steps up into a single command that pipes each stages’ output into the next like this:
dbt run-operation generate_metrics_schema --args '{table_schema: analytics, model_prefix: wh_, pk_suffix: _pk}' | \tail -n +3 | \bq query -use_legacy_sql=false -format sparse | \tail -n +3 > schema.yml
Only thing then left to do is add my join definitions into the schema definitions using a syntax very similar to LookML, like this:
- name: wh_ad_campaigns_dimmeta:label: "Wh Ad Campaigns Dim"joins:- join: wh_ad_campaign_performance_factsql_on: ${wh_ad_campaigns_dim.ad_campaign_pk} = ${wh_ad_campaign_performance_fact.ad_campaign_pk}- join: wh_web_sessions_factsql_on: ${wh_ad_campaigns_dim.ad_campaign_pk} = ${wh_web_sessions_fact.ad_campaign_pk} and ${wh_ad_campaign_performance_fact.campaign_date} = date(${wh_web_sessions_fact.session_start_ts})- join: wh_web_events_factsql_on: ${wh_web_sessions_fact.web_sessions_pk} = ${wh_web_events_fact.web_sessions_pk}
I could also add custom measure and dimension definitions alongside the auto-generated ones to, for example, provide basic currency conversion for our revenue metric:
- name: billing_revenue_gbpmeta:dimension:label: "Billing Revenue GBP"sql: "case when lower(${invoice_status}) in ('open','paid') then case when ${invoice_currency} = 'USD' then ${invoice_local_total_revenue_amount} * 0.73 when ${invoice_currency} = 'CAD' then ${invoice_local_total_revenue_amount} * 0.57 when ${invoice_currency} = 'EUR' then ${invoice_local_total_revenue_amount} * 0.85 else ${invoice_local_total_revenue_amount} end end"type: numberhidden: yesmetrics:total_billing_revenue_gbp:type: sum
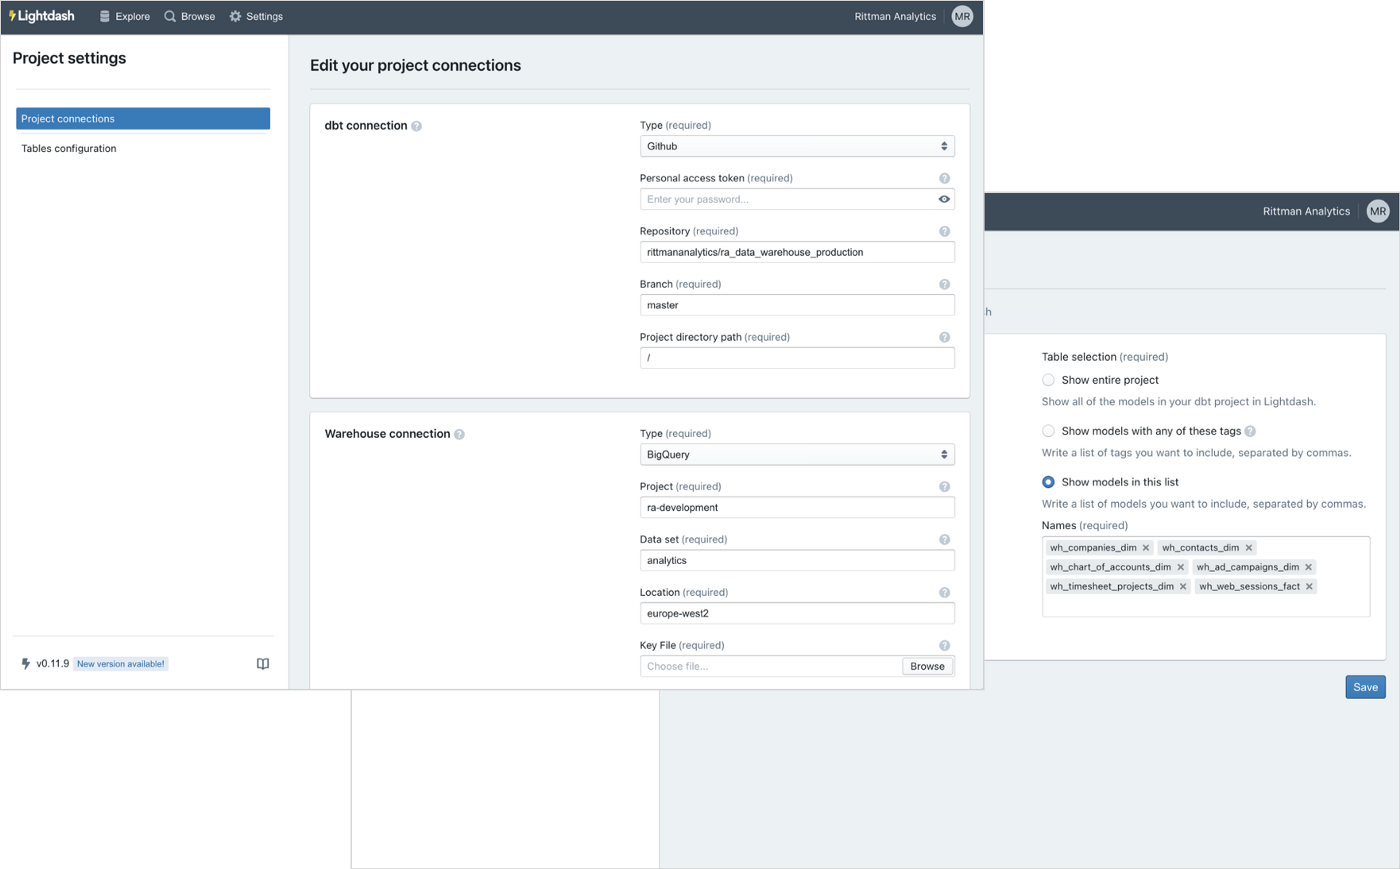
Next, I go into Lightdash and register the URL for my dbt git repo along with connection details for my BigQuery data warehouse.
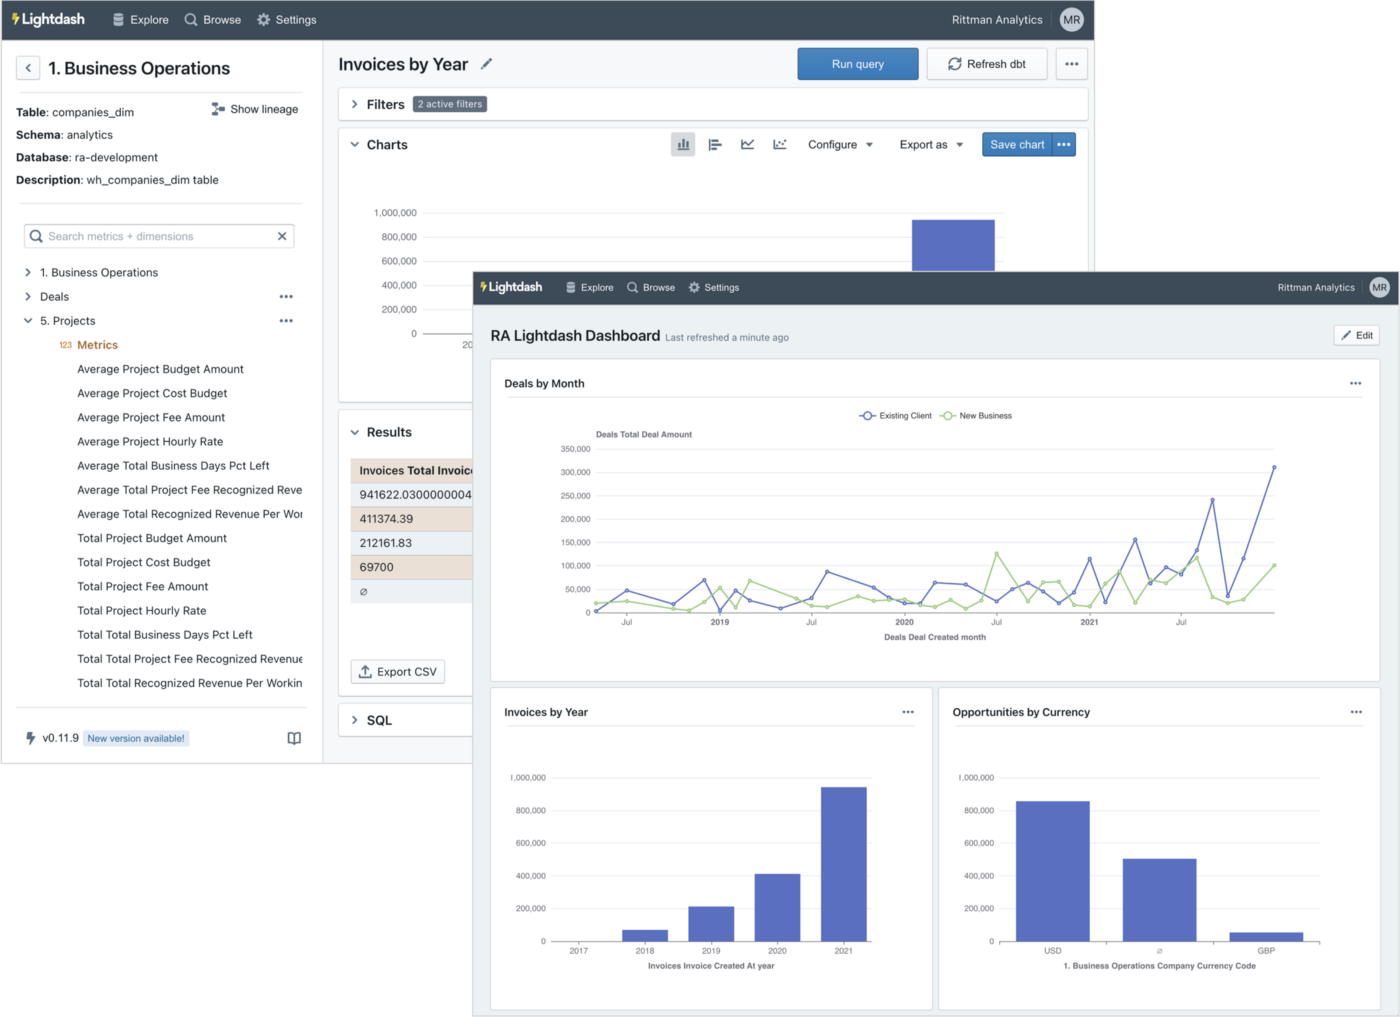
And once that’s done, I can start creating queries and building dashboards using dbt as the metrics layer for my BI tool rather than having to develop it all again in another BI tool and thereafter keep it in-sync with my dbt model.
To be fair and realistic, it’s early days for Lightdash and the range of charts, configuration options and features within their metrics layer are still fairly primitive; there’s no equivalent to LookML’s symmetric aggregates capability yet, for example, and no access grants, Liquid templating and so on.
But the allure of having just one metadata store for both your warehouse transformations and metrics definitions is certainly a compelling one and we’ll be keeping an eye on Lightdash as the product, and the startup behind it, evolves — and contact us now if you’re looking at Lightdash and need a hand in evaluating it and getting it up and running for your organization.
Interested? Find out More
Rittman Analytics is a boutique analytics consultancy specializing in the modern data stack who can get you started with Looker (and Lightdash!), centralise your data sources and enable your end-users and data team with best practices and a modern analytics workflow.
If you’re looking for some help and assistance building-out your analytics capabilities on a modern, flexible and modular data stack, contact us now to organize a 100%-free, no-obligation call — we’d love to hear from you!
Recommended Posts
How Rittman Analytics uses AI-Augmented Project Delivery to Provide Value to Users, Faster
An Homage to Oracle Warehouse Builder, 25 Years Ahead of Its Time

When Your Talented Data Team is Stuck in Second-Gear
